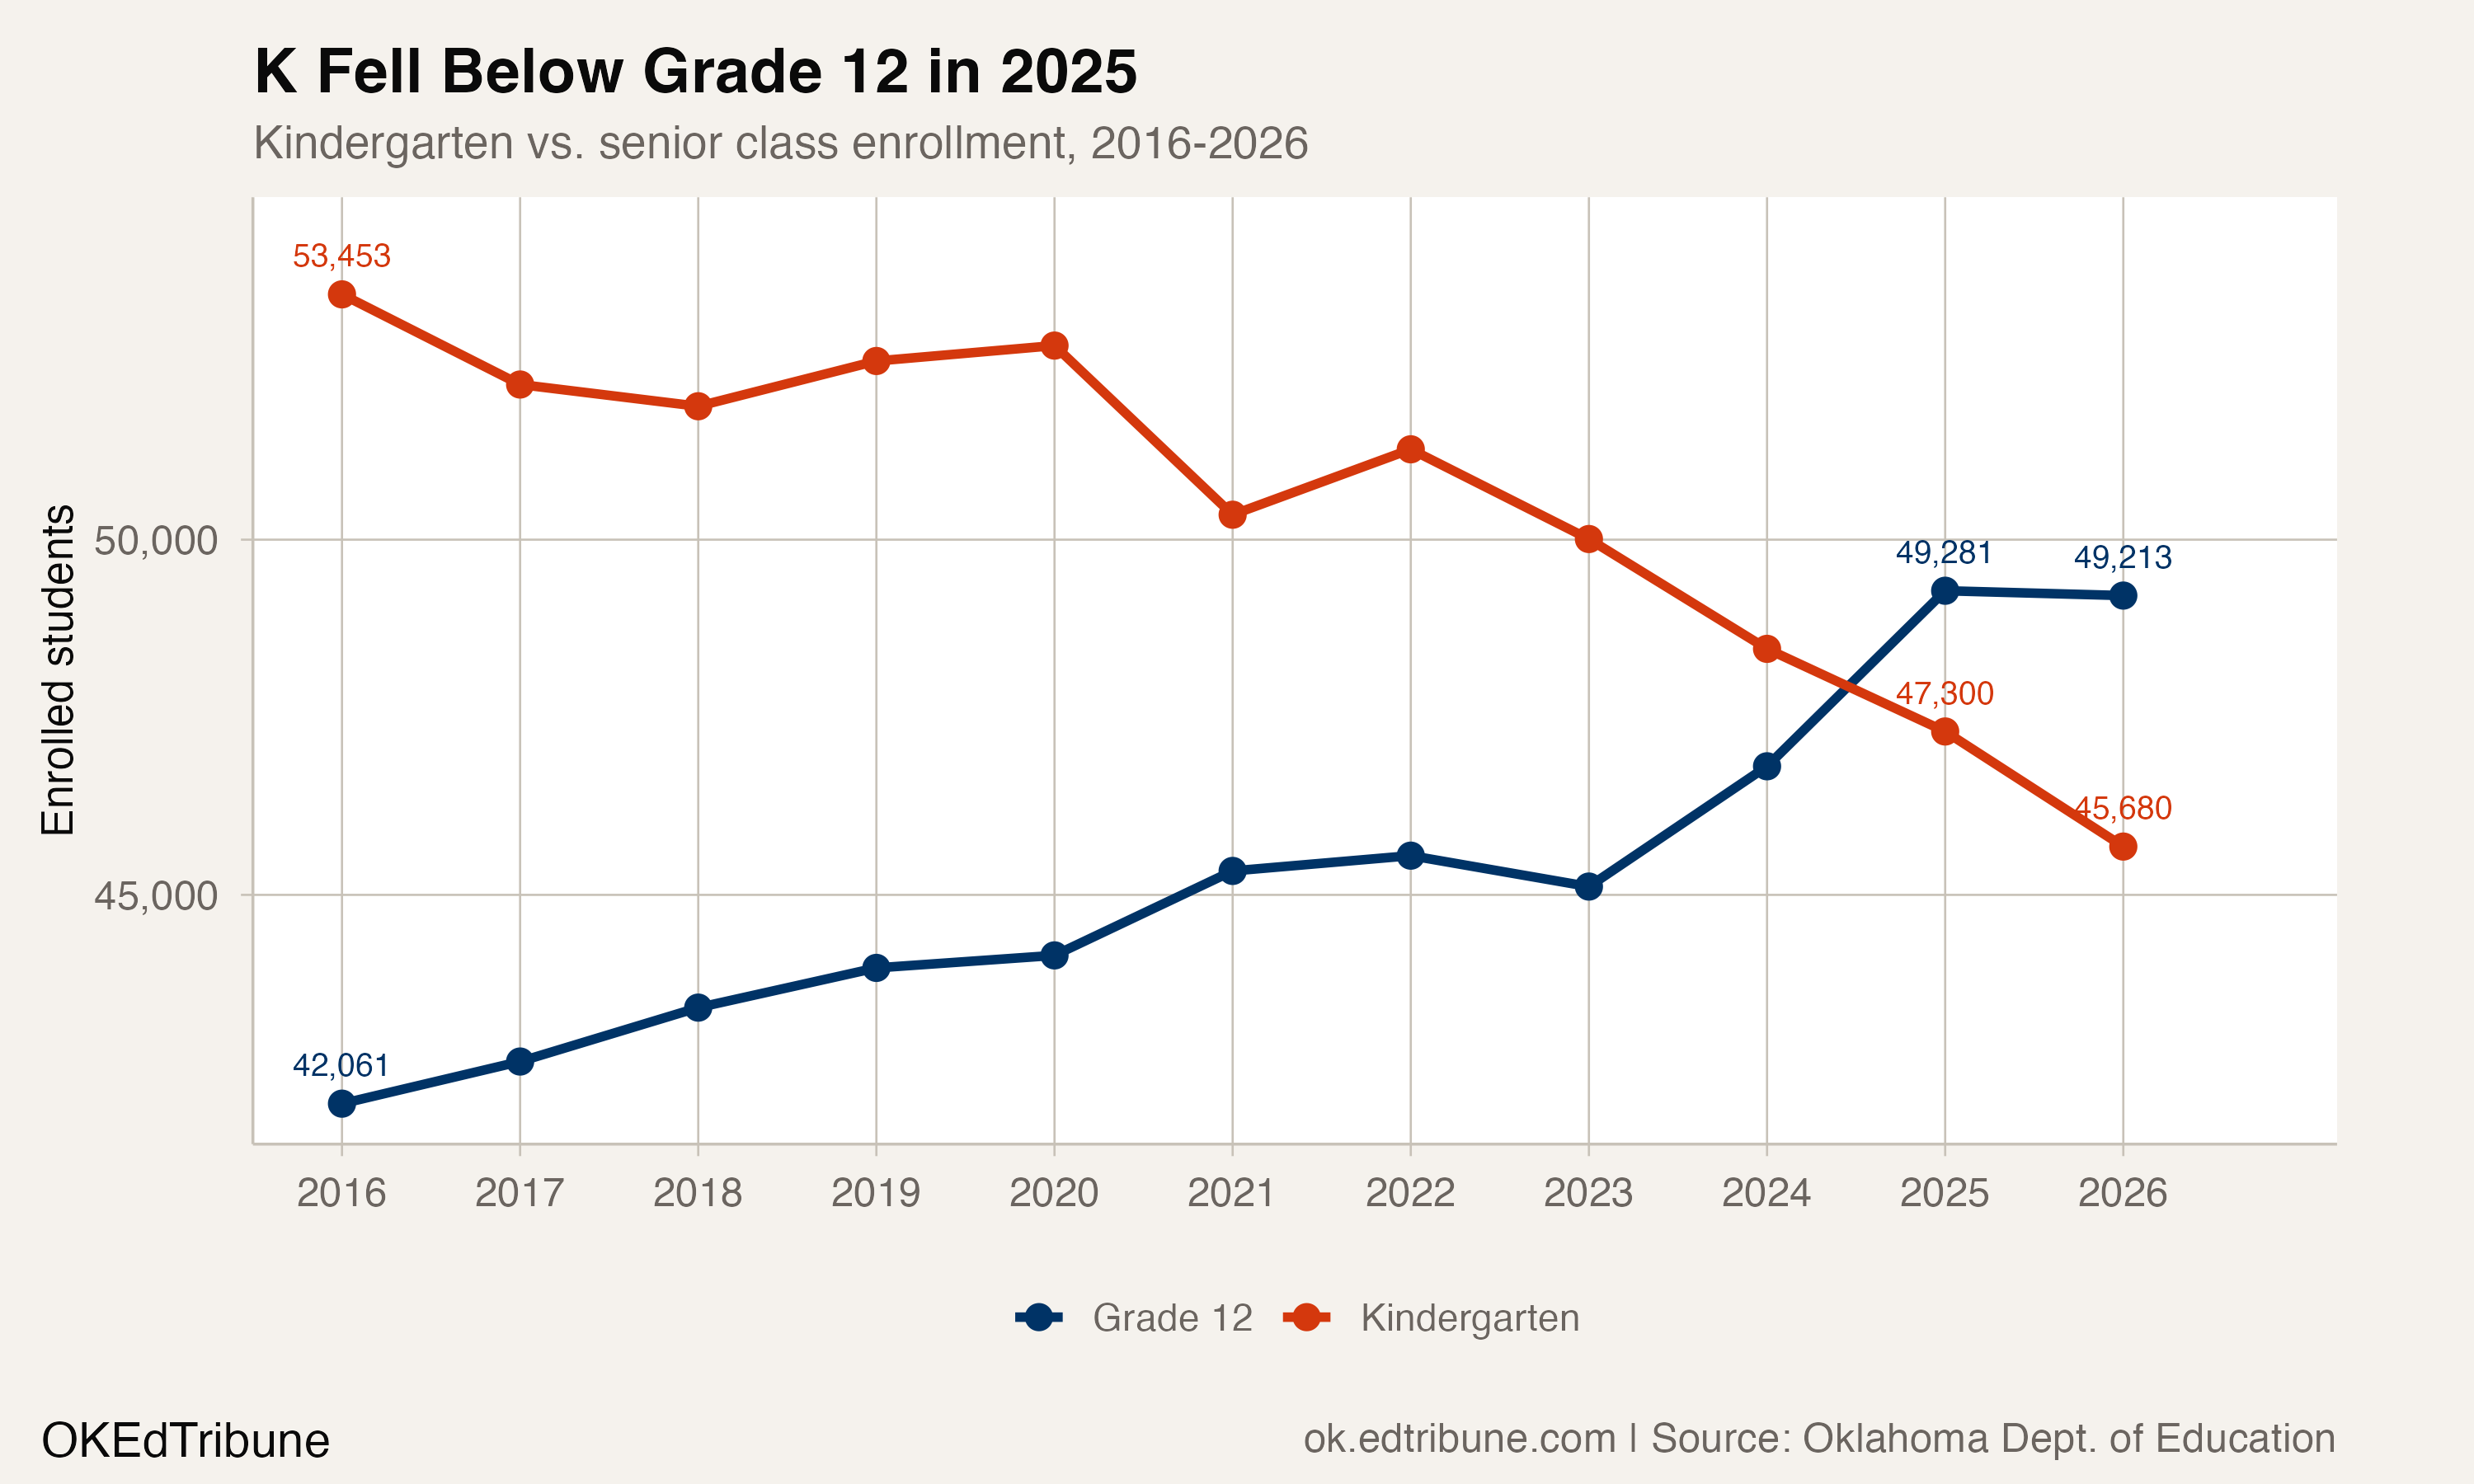
For every kindergartner who walked into an Oklahoma public school in fall 2025, a senior walked out the other end and took a friend. The state enrolled 45,680 kindergartners in 2025-26 but counted 49,213 seniors, a gap of 3,533 students. That inversion, which appeared for the first time just last year, is a symptom of a deeper structural shift: Oklahoma's elementary pipeline is emptying while its high schools are still riding the momentum of larger cohorts born a decade ago.
Grades K-3 have shed 26,484 students since 2015-16, a 12.2% decline. Grades 9-12 added 19,955, a 10.7% gain. The combined swing of 46,439 students between the two grade bands amounts to 6.8% of the state's total enrollment, redistributed from the bottom of the pipeline to the top.
The crossover that districts felt before they saw it
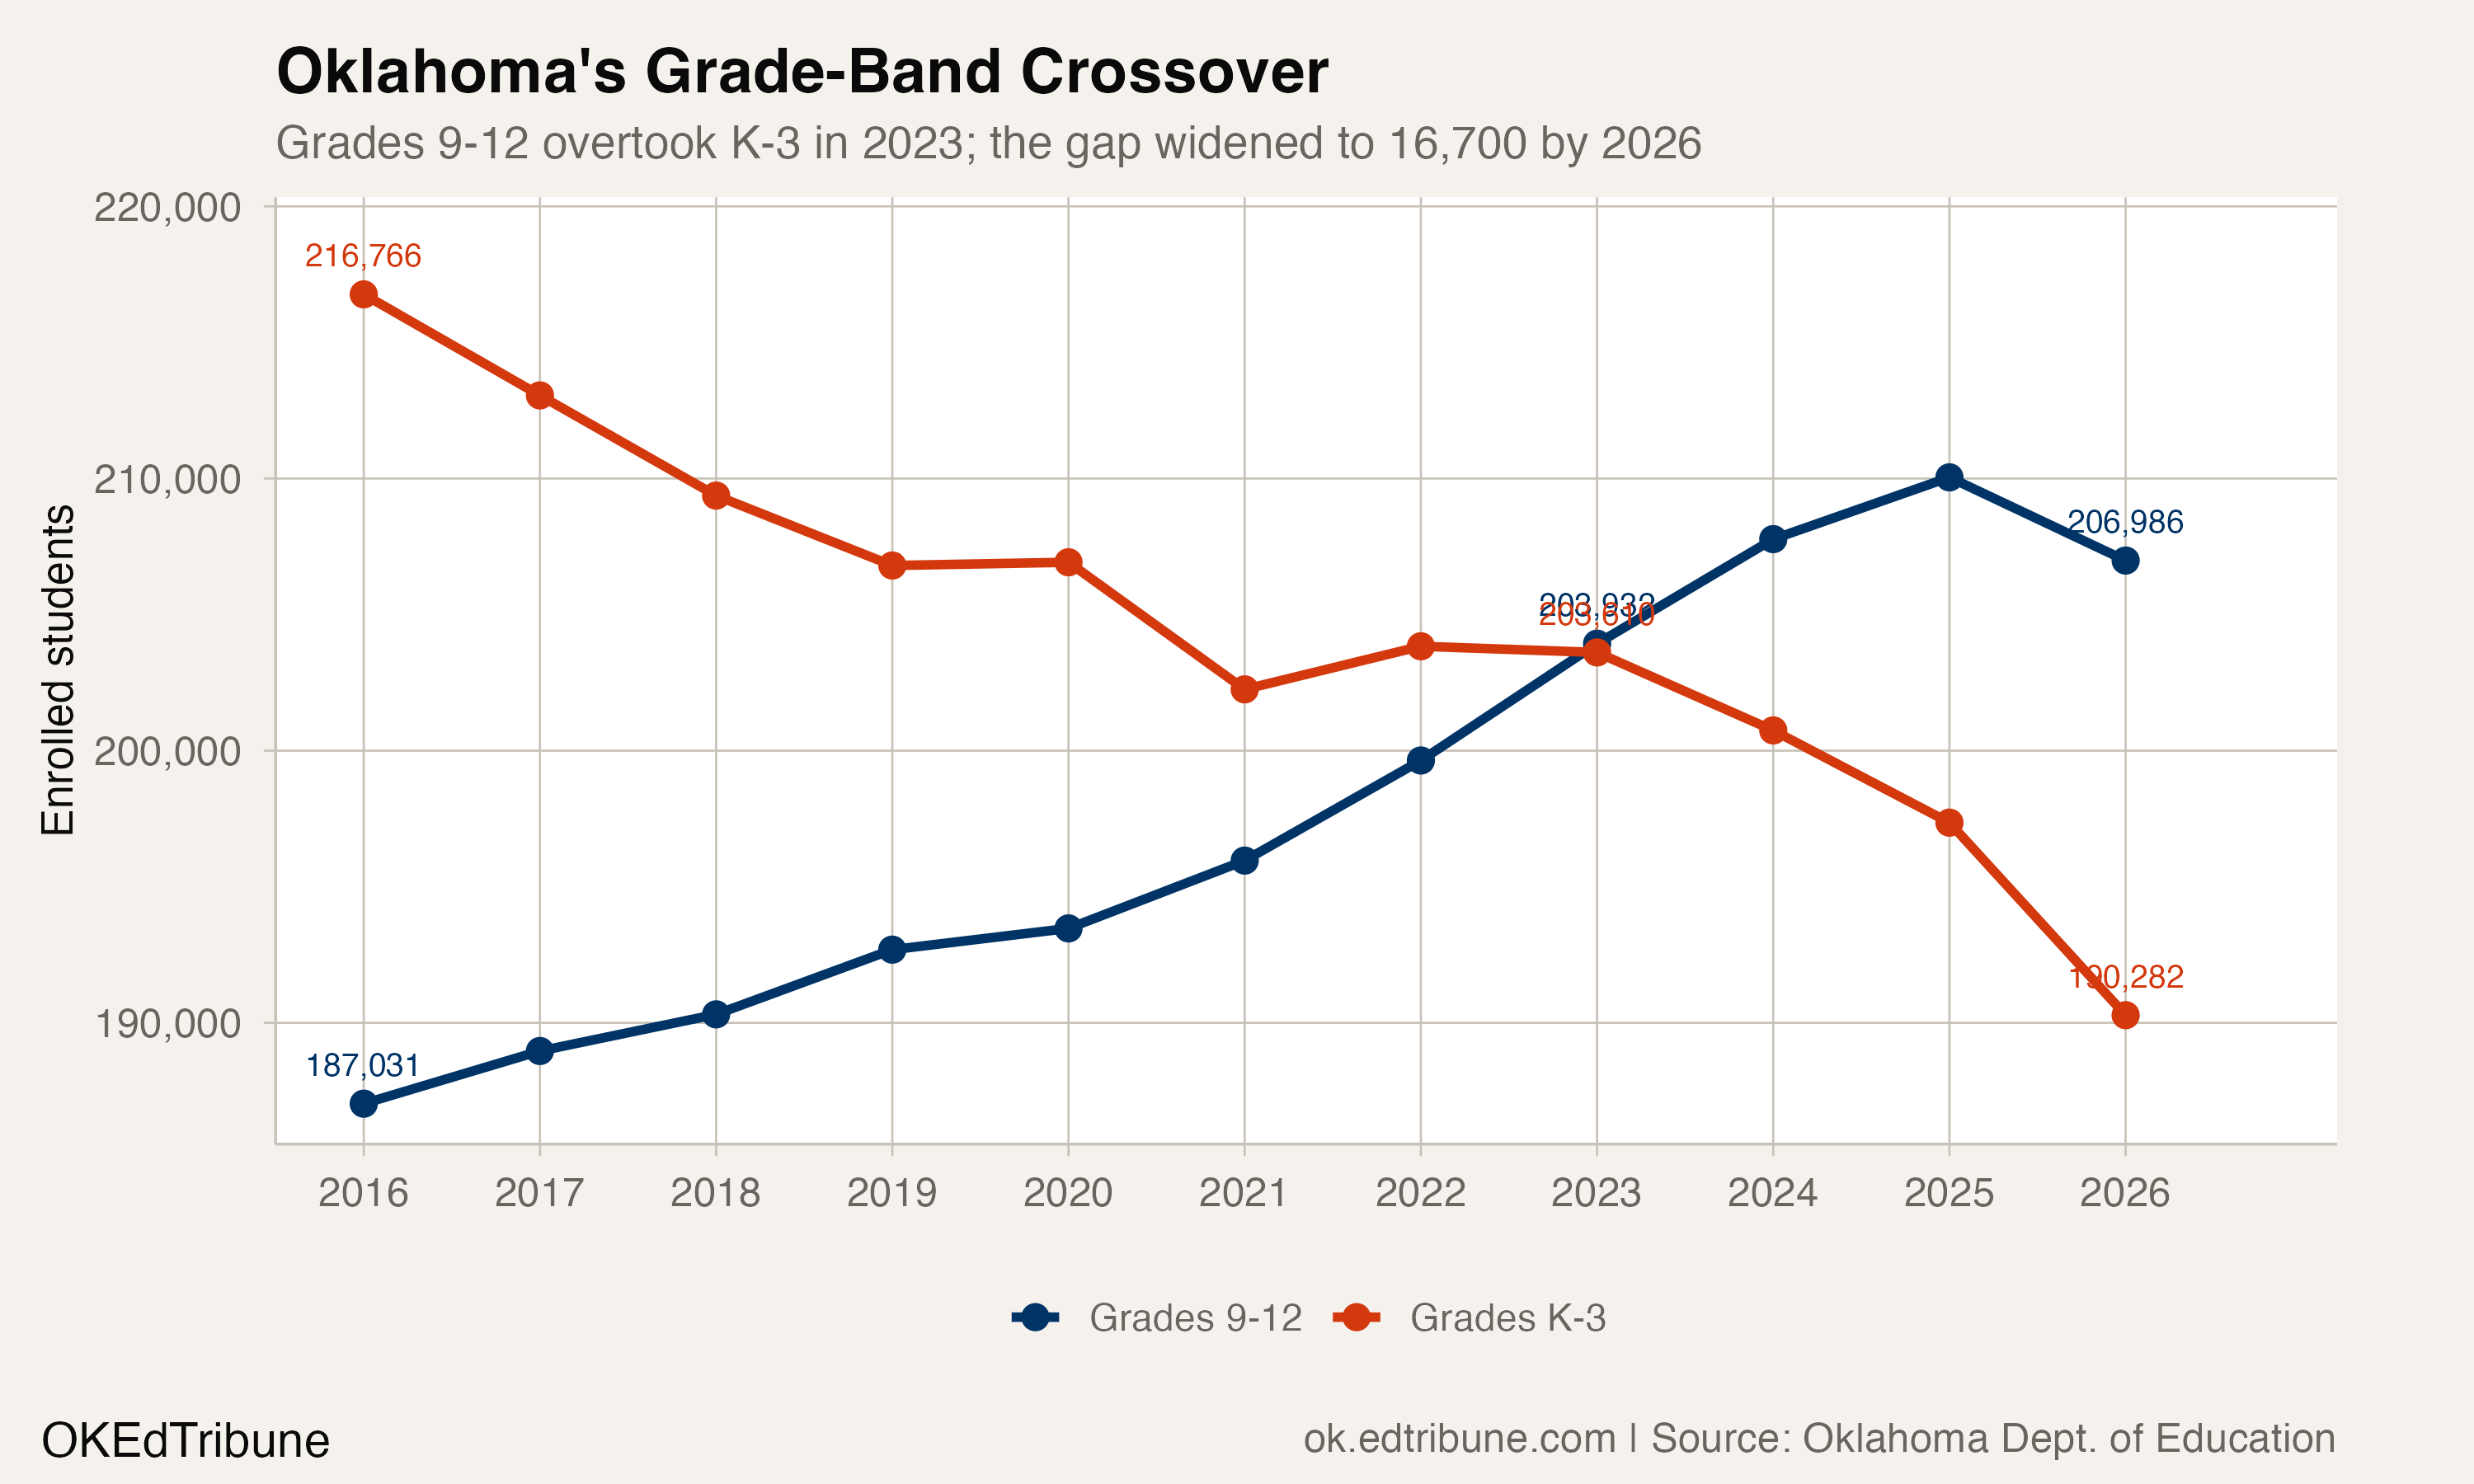
For years, Oklahoma's K-3 band was comfortably larger than its 9-12 band. In 2015-16, K-3 enrolled 216,766 students, nearly 30,000 more than the 187,031 in grades 9-12. That cushion shrank steadily. By 2022-23, the two lines touched. In 2023-24, grades 9-12 pulled ahead for the first time, and by 2025-26 the gap had widened to 16,704 students.
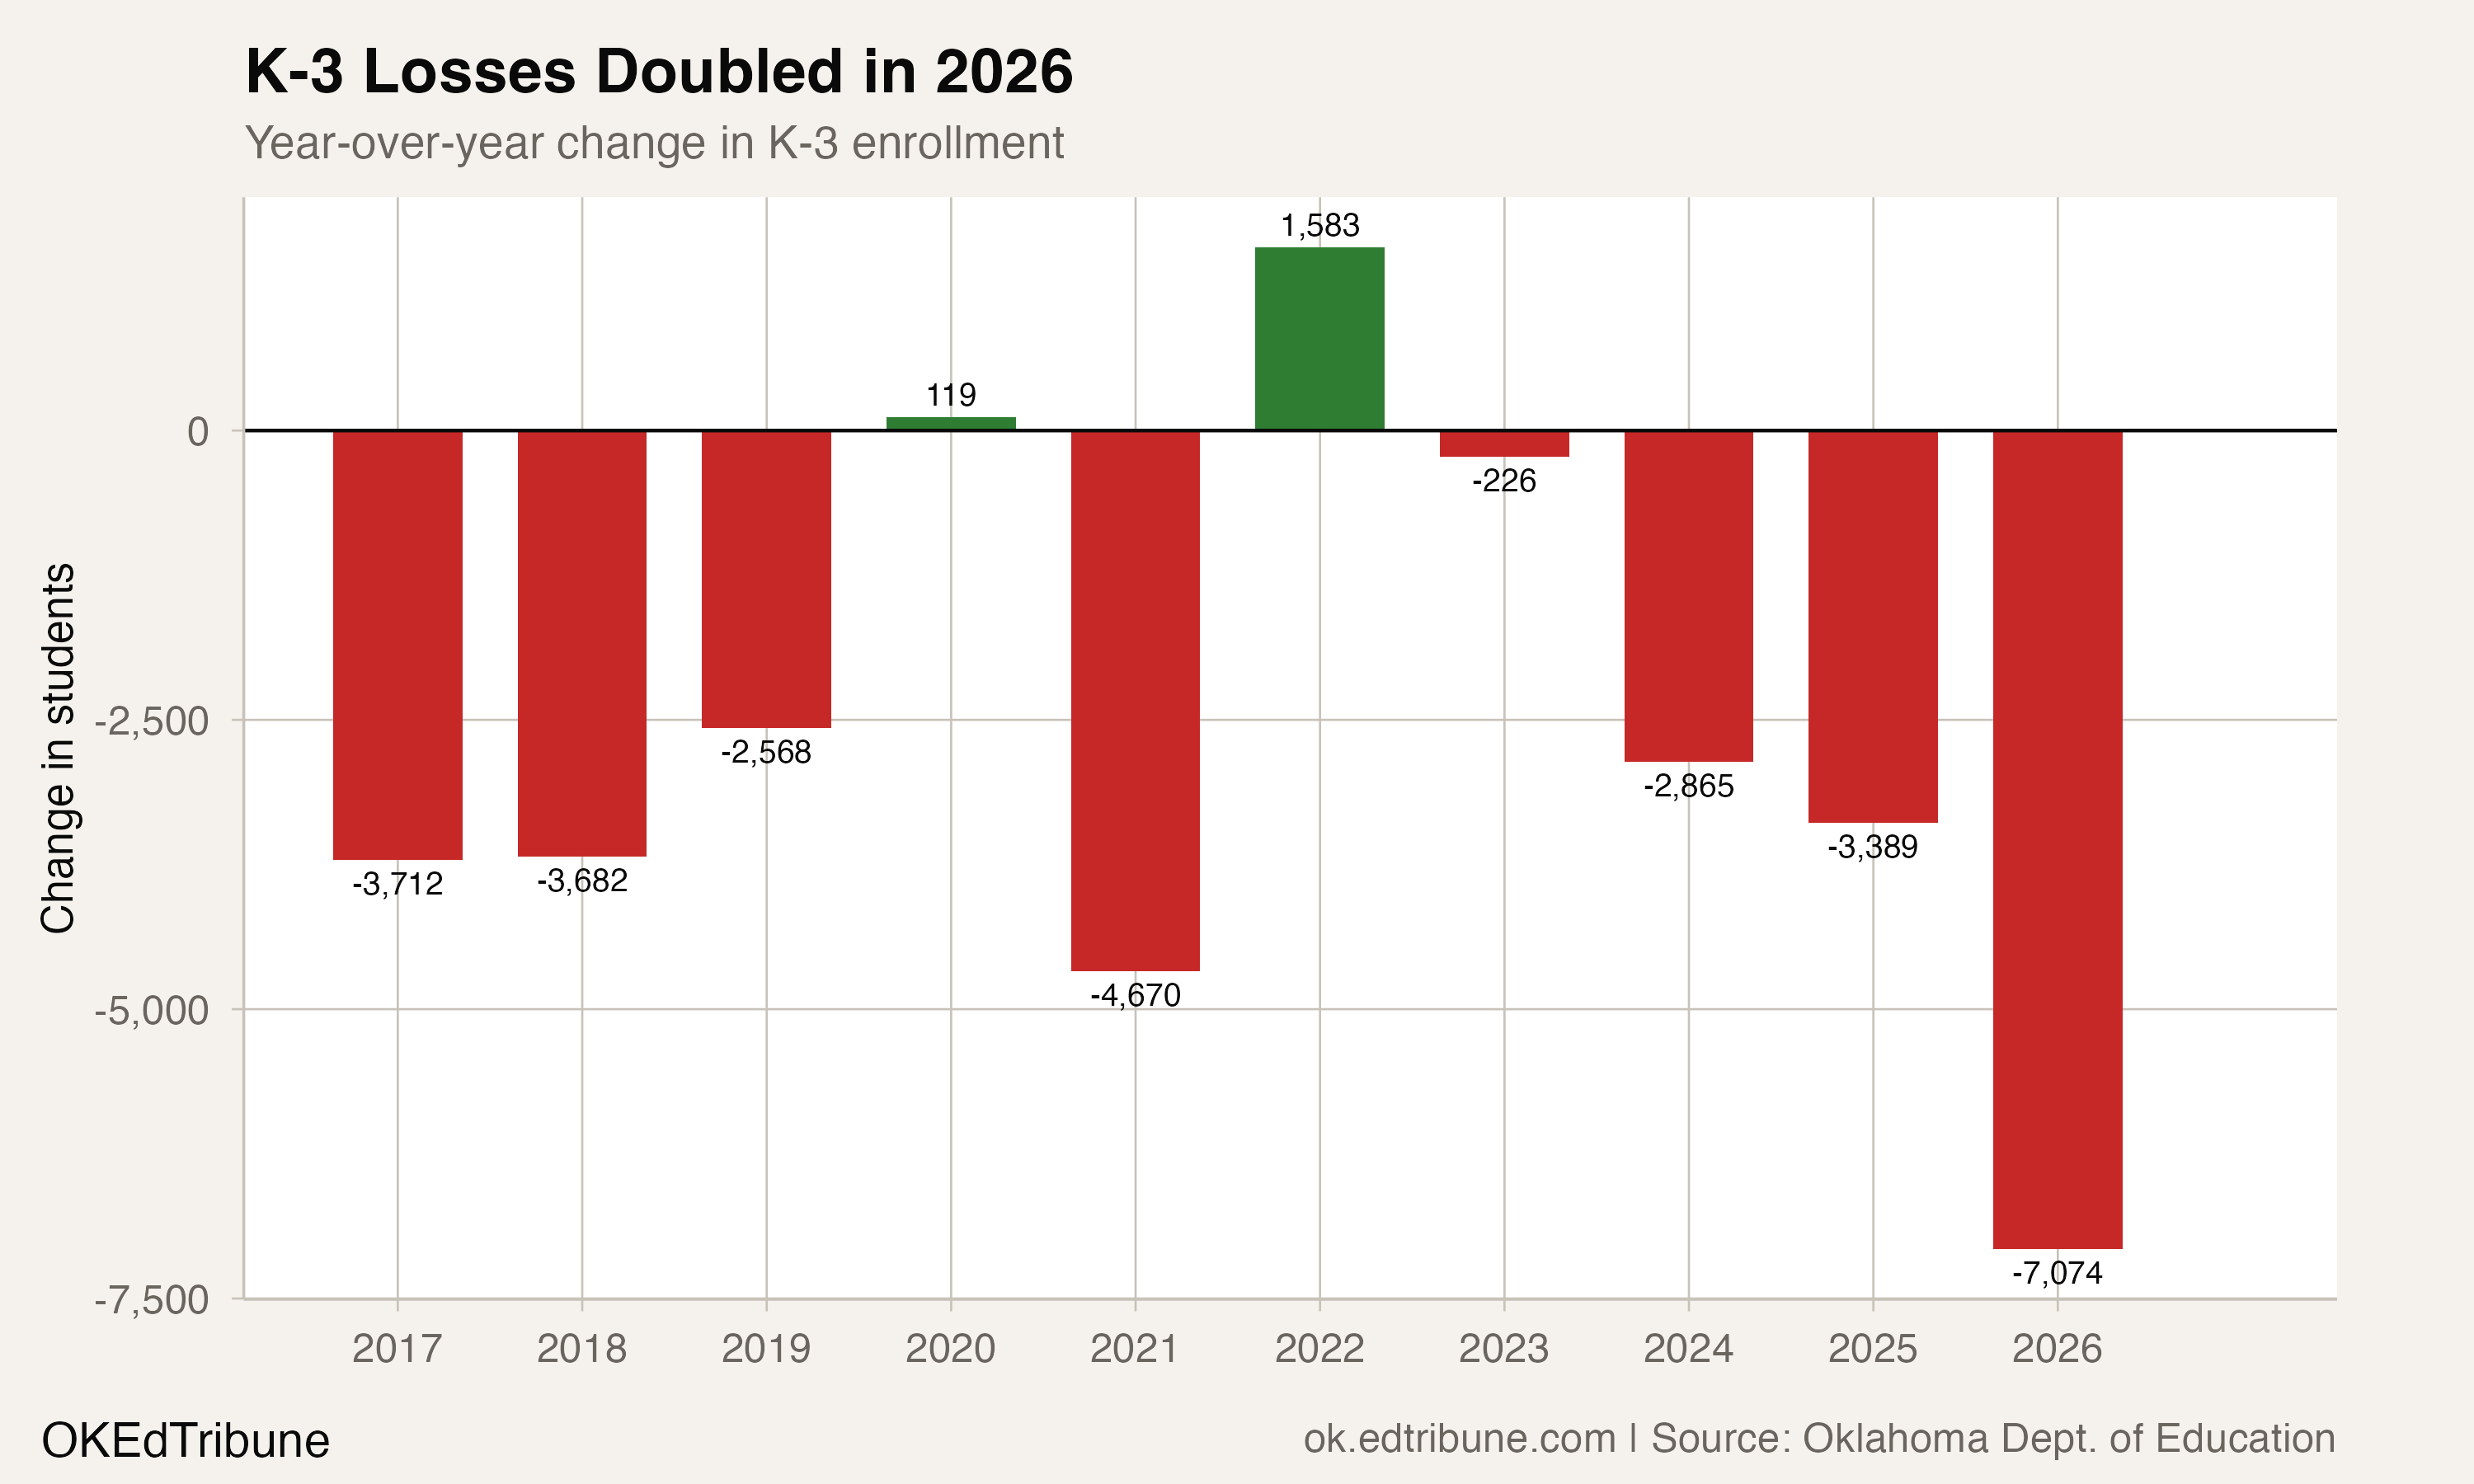
Elementary principals have been managing this contraction for a decade. The acceleration in 2025-26 made it impossible to ignore: K-3 lost 7,074 students in a single year, more than double the 3,389 lost the year before and the largest one-year K-3 drop in the dataset.
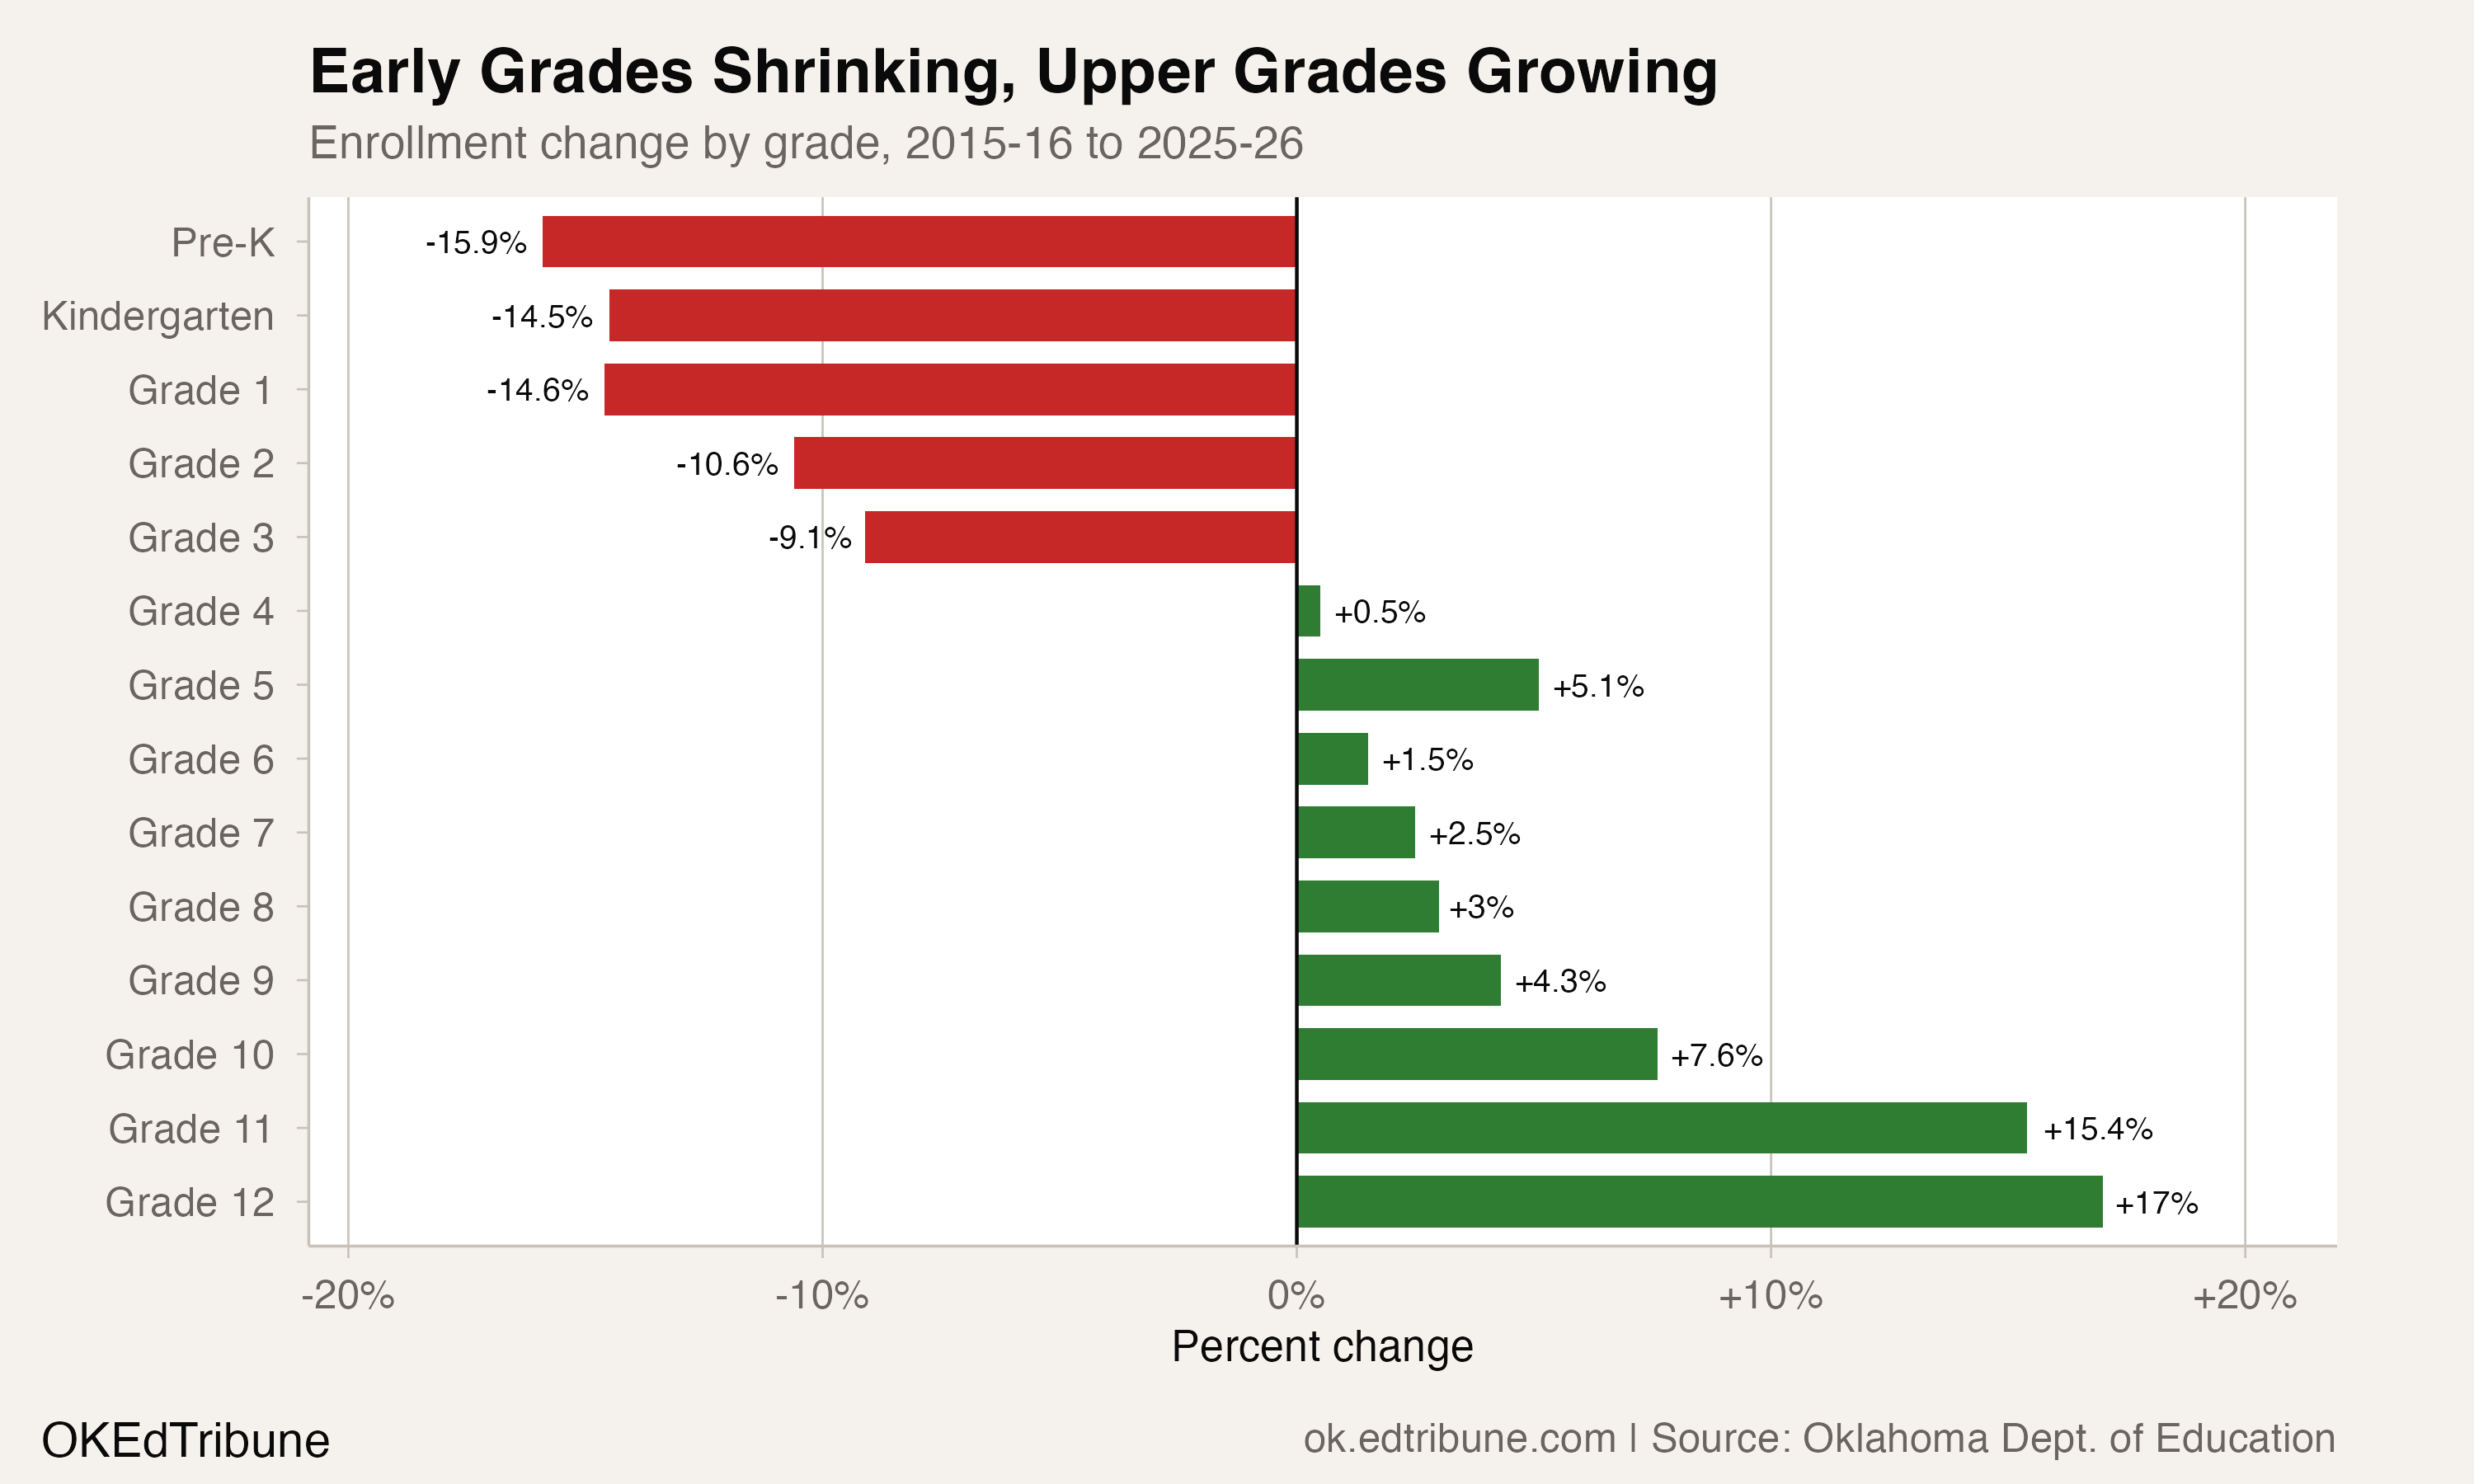
The losses are not uniform across grades. Pre-K is down 15.9% since 2015-16, kindergarten 14.5%, first grade 14.6%. The magnitude fades as grades rise: second grade is down 10.6%, third grade 9.1%. By fourth grade, the change flips positive. Grades 4 through 8 are collectively up 2.5%, absorbing the tail end of the larger cohorts that passed through elementary school earlier. Grades 11 and 12, populated by students born in 2007-2009 when Oklahoma's birth rate was higher, are up 15.4% and 17.0% respectively.
Fewer births, more exits
The primary driver is demographic. Oklahoma's fertility rate fell nearly 12% between 2013 and 2023, tracking a national decline that pushed the U.S. fertility rate to 1.6 births per woman in 2024, well below the 2.1 replacement threshold. Children born in 2020, when births dipped further during the pandemic, entered kindergarten in 2025-26. That cohort of 45,680 is the smallest kindergarten class in the dataset by a wide margin, 14.5% below the 53,453 who started kindergarten in 2015-16.
The birth-rate mechanism explains the shape of the decline: losses concentrated at the bottom of the pipeline, fading in the middle grades, and absent at the top. It does not explain the entire magnitude. Oklahoma's Parental Choice Tax Credit program has expanded rapidly since its launch. As of May 2025, 36,860 children had been approved for credits in the 2025-26 school year, of whom 2,999 were currently enrolled in a public school. The numbers suggest a modest but real diversion from the public system. Because the program does not publish participation by grade level, it is not possible to isolate how much of the elementary decline reflects families choosing private or homeschool options rather than a smaller pool of children.
"We have a relatively cool housing market...and there is a declining birth rate in Oklahoma and across the nation." -- John Federline, Union Public Schools superintendent, Tulsa World, Jan. 2026
The state compounds the uncertainty by not requiring families to register for homeschooling. Oklahoma has no comprehensive count of privately educated students, making it impossible to distinguish between children who don't exist and children who attend school somewhere else.
Two cities carry the weight
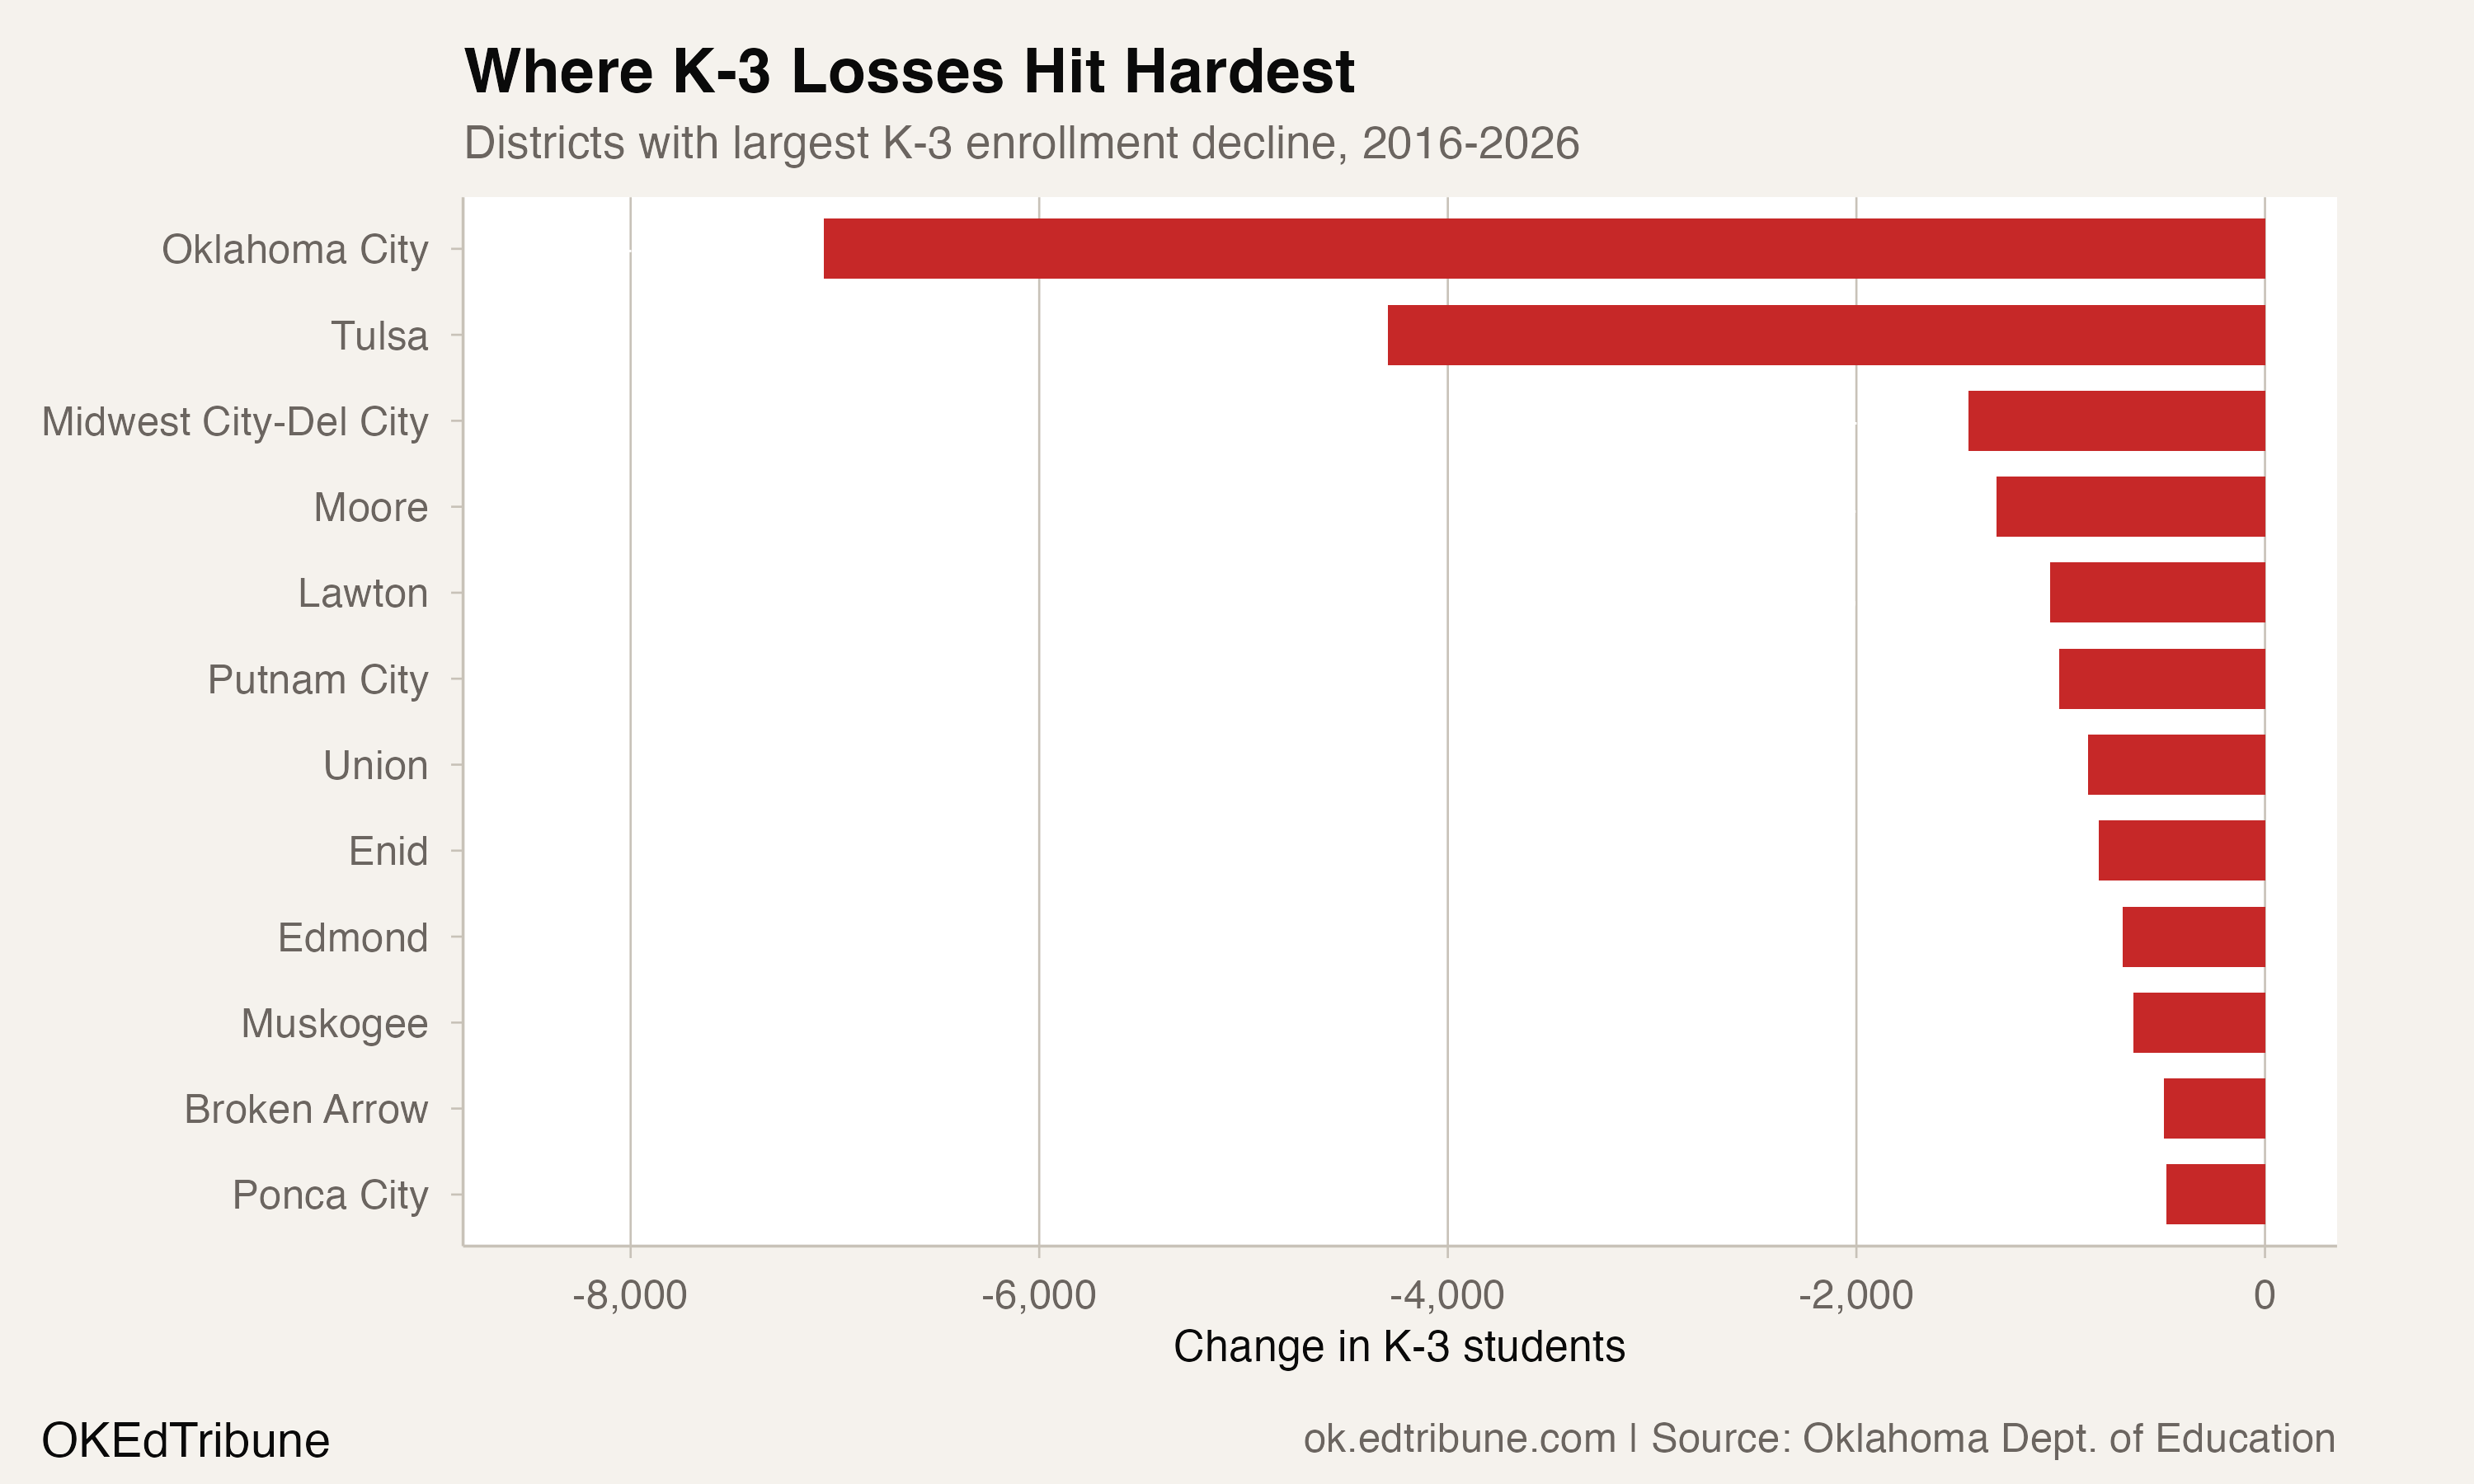
Oklahoma City↗ET and Tulsa↗ET account for 43% of the state's total K-3 losses. Oklahoma City's K-3 enrollment dropped from 16,423 to 9,367, a decline of 7,056 students, or 43.0%. Tulsa lost 4,293 K-3 students, a 29.1% decline. Together, the two districts shed 11,349 early-grade students while the rest of the state lost 15,135.
The concentration is not surprising. Both districts have lost total enrollment for years, driven by suburban migration, school choice programs, and a housing market that has shifted families toward outer-ring communities. Midwest City-Del City↗ET (-1,453 K-3 students, -30.8%), Moore↗ET (-1,314, -18.2%), and Union↗ET (-866, -18.4%) round out the top five losses. The pattern is consistent: urban and first-ring suburban districts are shrinking fastest at the elementary level.
The exceptions are outer suburbs and exurbs. Deer Creek↗ET gained 472 K-3 students (+26.0%), Bixby↗ET added 497 (+26.8%), and Mustang↗ET grew by 479 (+14.4%). These districts are absorbing families from the urban core, but their gains don't come close to offsetting what Oklahoma City and Tulsa are losing.
What this means for high schools, starting around 2030
The high school growth that Oklahoma is experiencing in 2025-26 is borrowed time. The 2016 kindergarten cohort of 53,453, now in 10th grade, is one of the last large classes in the pipeline. The 2021 kindergarten cohort of 50,351, now in fifth grade, will reach ninth grade in 2030. The 2026 kindergarten cohort of 45,680, the smallest on record, will not arrive at high school until 2035.
Between now and then, grades 9-12 will plateau and begin contracting. The 9-12 band already dipped in 2025-26, losing 3,057 students after nine consecutive years of growth, though this likely reflects a one-year fluctuation rather than the start of the structural decline. That structural decline, when it arrives, will compress the budget from both ends: fewer students in elementary schools that are already losing per-pupil funding, and fewer students in the high schools that had been the one stable line item.
Oklahoma ranks 49th nationally in per-pupil spending, according to the National Education Association's 2023-24 data. The state's funding formula allocates dollars based on headcount, with weighted adjustments for grade level and special populations. Elementary schools with shrinking K-3 cohorts are already seeing their allocations contract. When high schools follow, the fiscal pressure will extend to the grade bands that currently look healthy.
Elementary enrollment will keep falling. The children who would fill those classrooms in 2030 have already been born, or not. High school enrollment will follow around 2031, when the smaller 2025-26 kindergarten cohorts reach ninth grade. Between 2026 and then, districts are operating in a brief window where upper grades still generate enough per-pupil funding to subsidize shrinking elementary buildings. That window is closing. Every district that does not consolidate or restructure before it shuts will be doing so under fiscal duress instead.
Detailed code that reproduces the analysis and figures in this article is available exclusively to EdTribune subscribers.
Discussion
Sign in to join the discussion.
Loading comments...