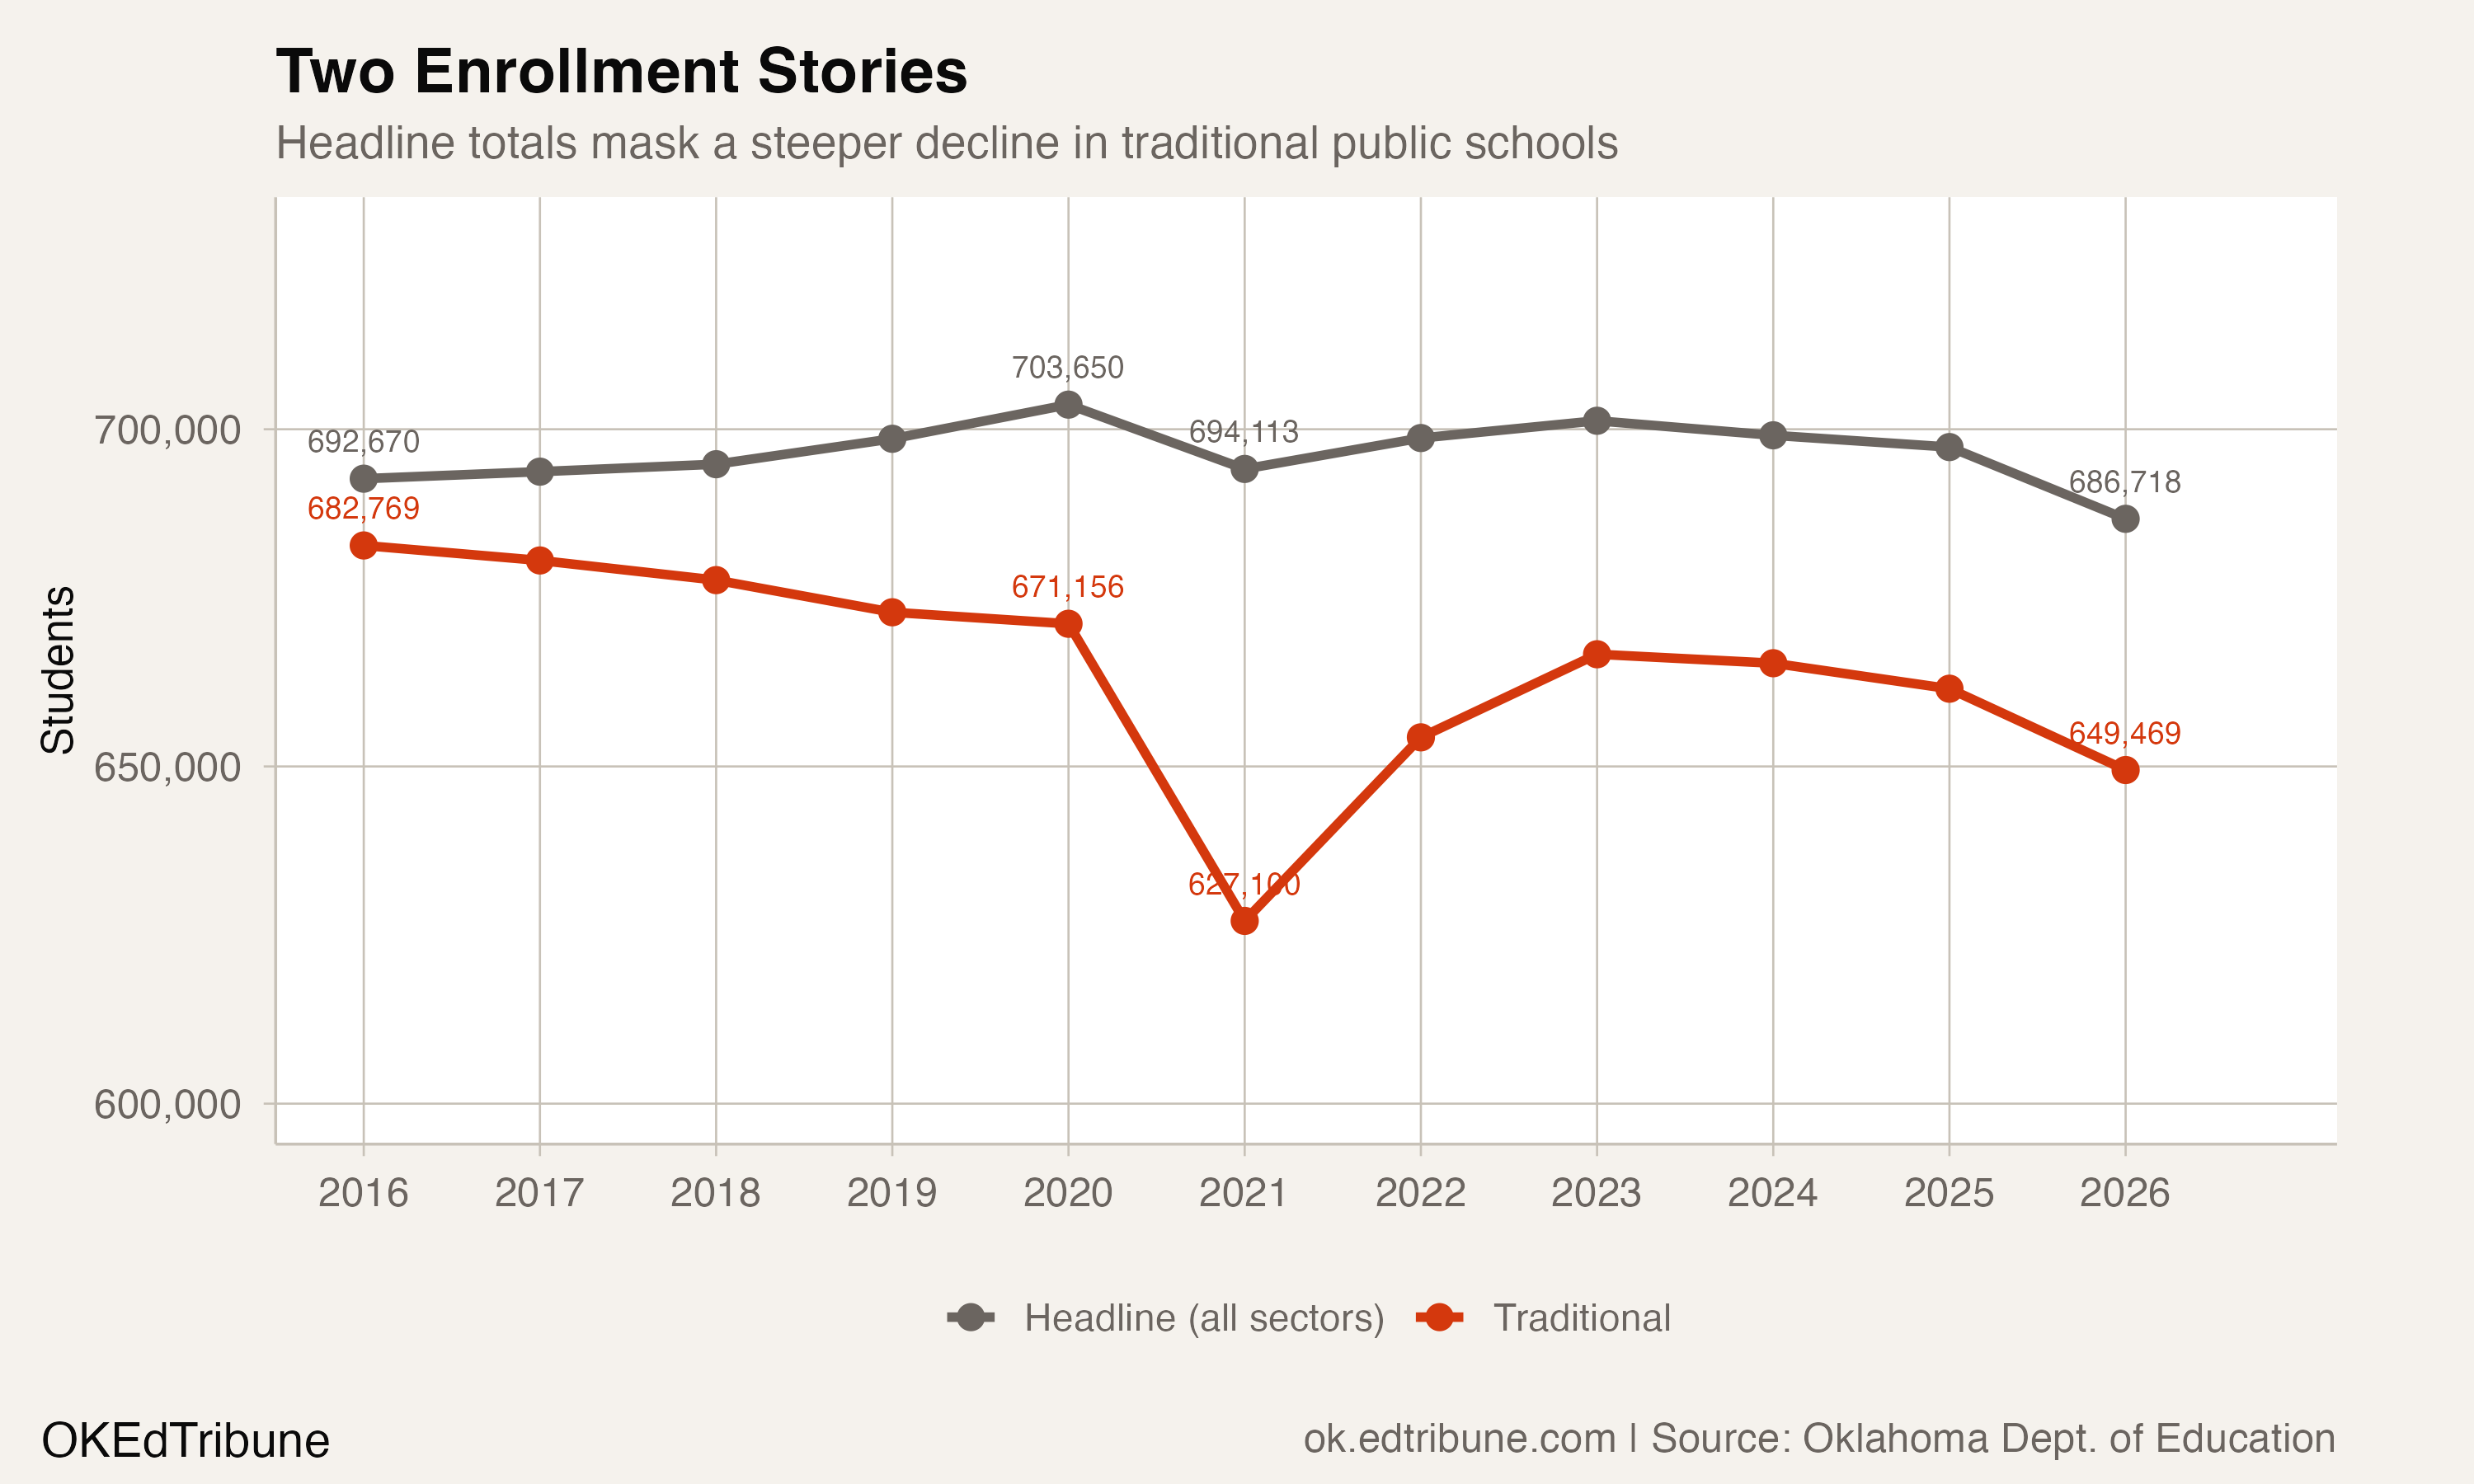
Oklahoma's statewide enrollment has barely moved in a decade. At 686,718 students in 2025-26, the total sits just 5,952 below its 2015-16 level, a decline of 0.9%. By national standards, that number looks like stability.
It is not. The state total blends two school systems moving in opposite directions. Traditional public schools enrolled 682,769 students in 2015-16. In 2025-26 they enrolled 649,469, a loss of 33,300 students, or 4.9%. Virtual charter schools, led by Epic Charter Schools, grew from 9,901 to 37,249 over the same period, absorbing enough students to make the combined number look almost flat.
The 27,348-student gap between the headline and reality is a structural shift that Oklahoma's aggregate enrollment data, the number that appears in state reports and national databases, was never designed to show. (Oklahoma does not flag charter or virtual schools in its enrollment files. The virtual sector here includes seven entities identified by name: Epic, Oklahoma Virtual Charter Academy, Oklahoma Connections Academy, Insight School, eSCHOOL, Dove Virtual Academy, and Virtual Preparatory Academy. Brick-and-mortar charter schools remain in the traditional count.)
A decade of quiet erosion
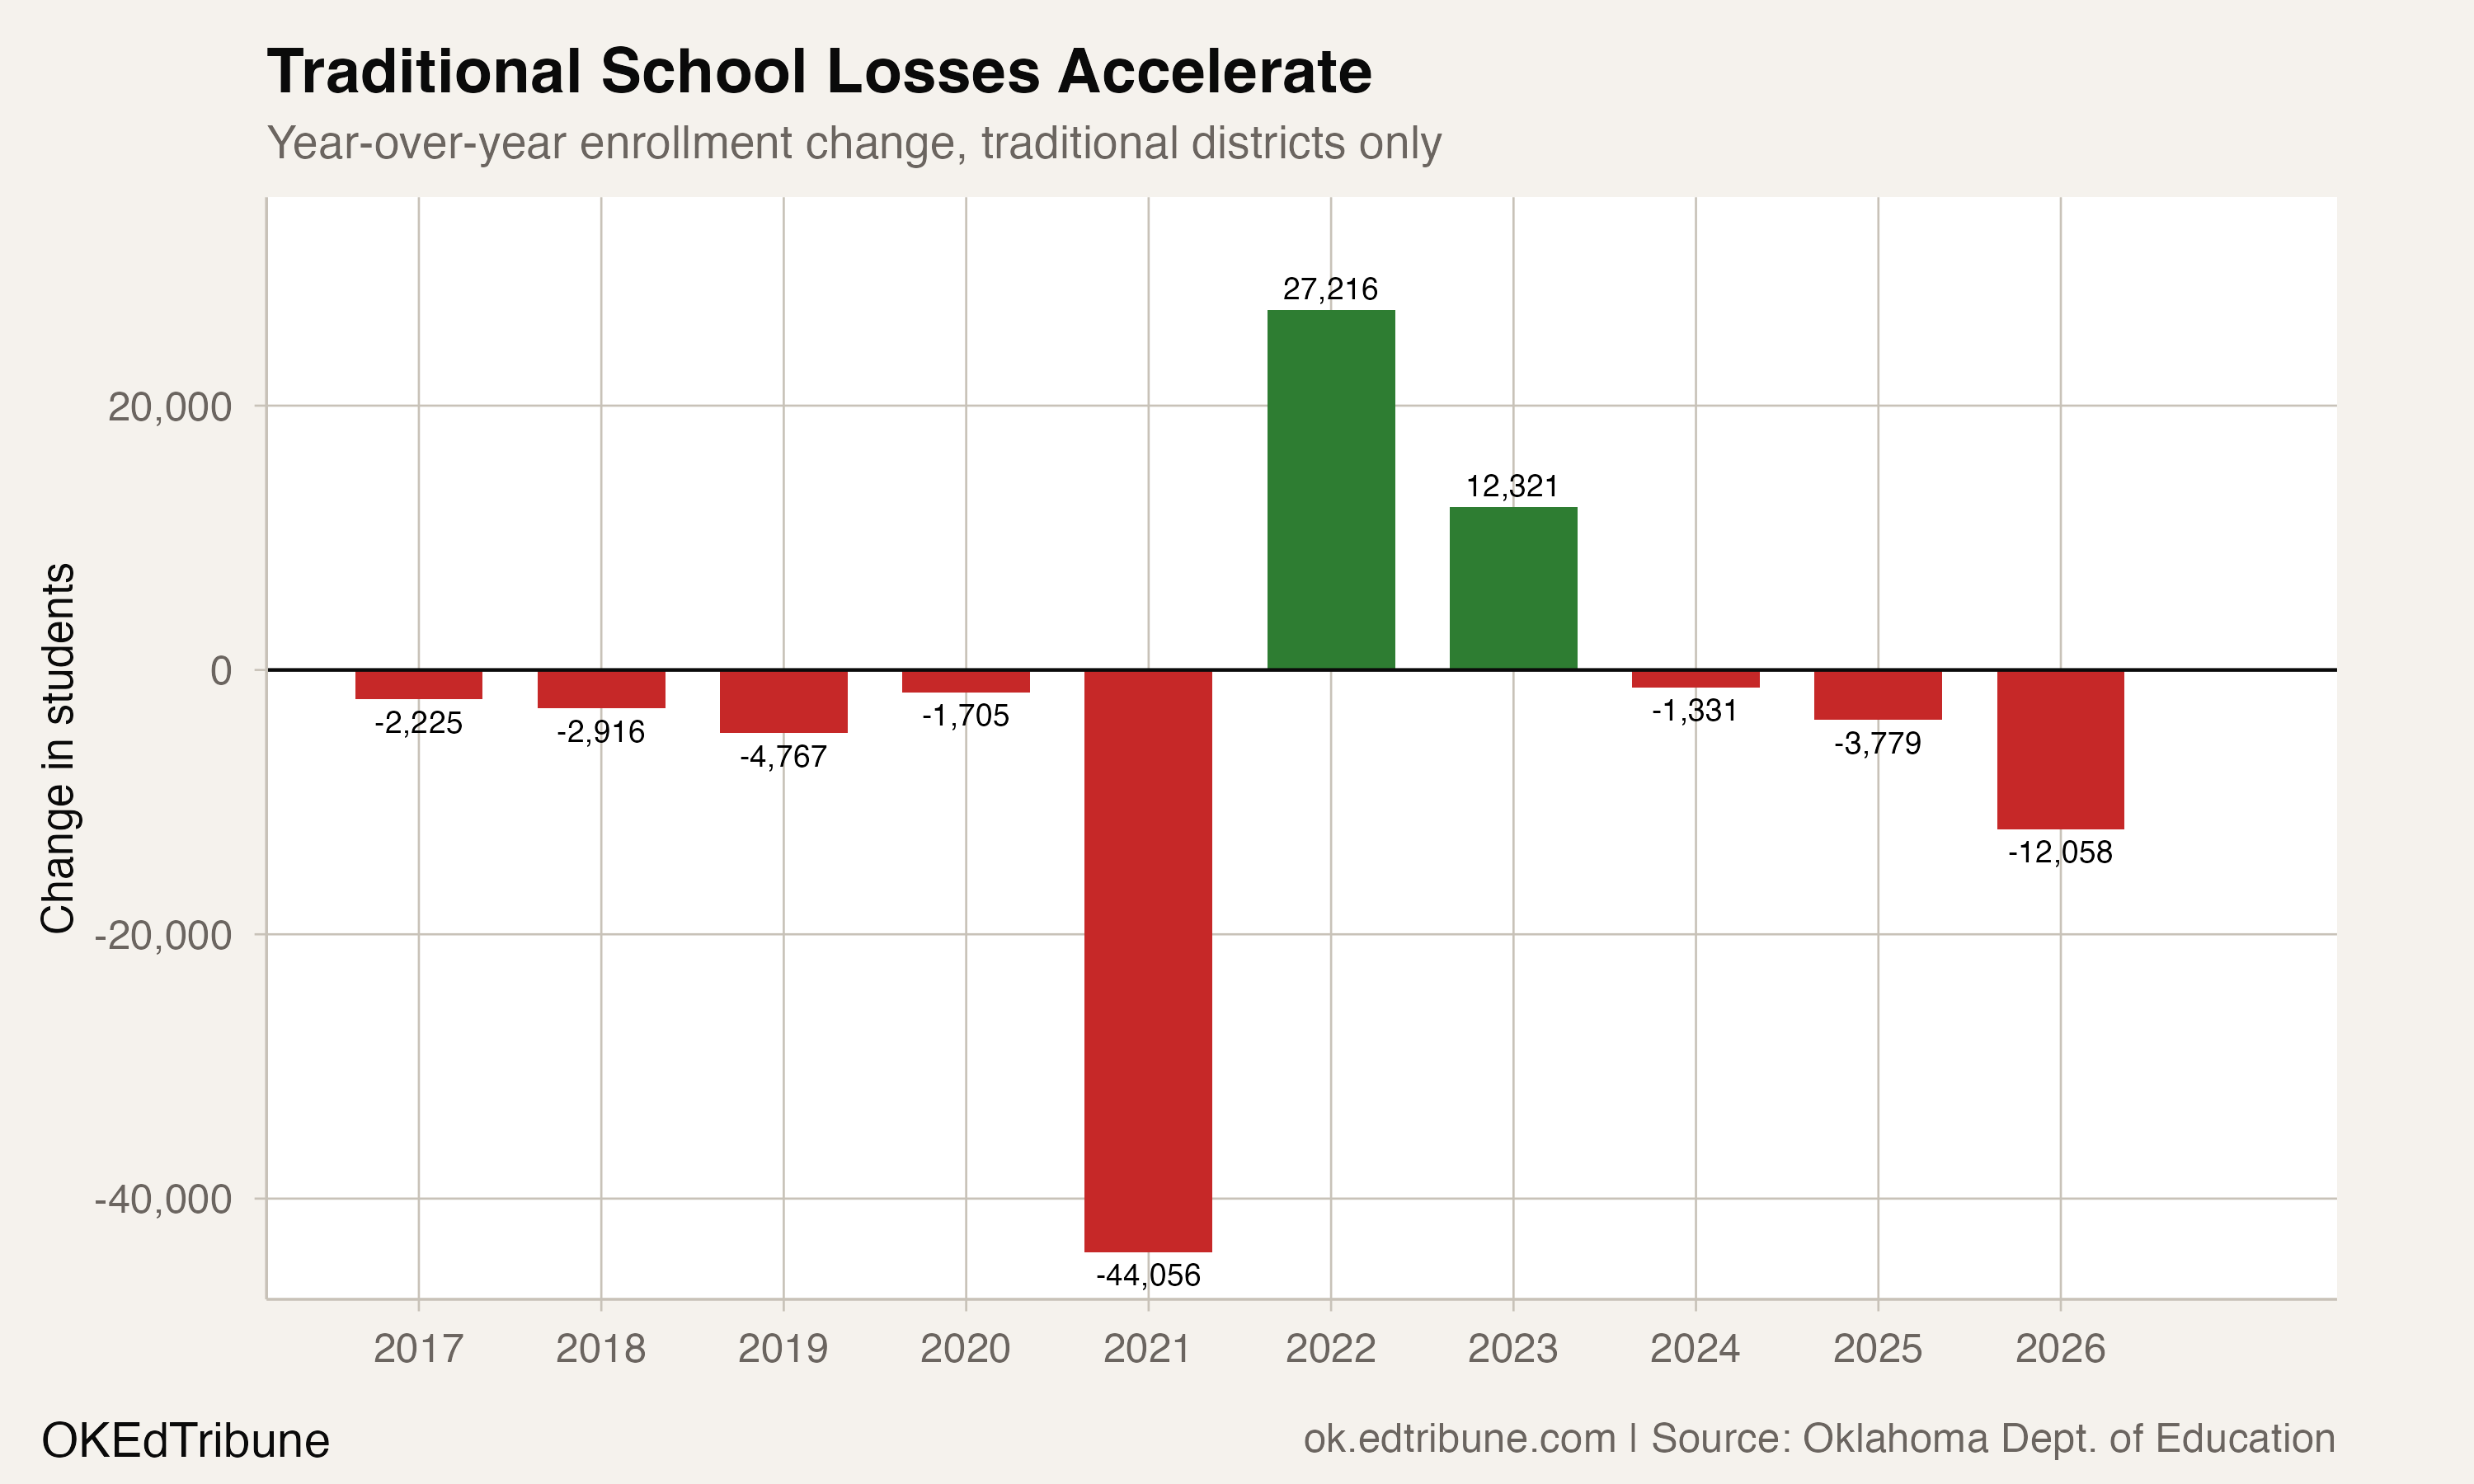
Traditional districts were already losing students before COVID-19. Between 2015-16 and 2019-20, they shed 11,613 students at a pace of roughly 2,000 to 5,000 per year. The losses were steady enough to avoid headlines, spread across hundreds of small and mid-sized districts where a few dozen departures each year registered as background noise.
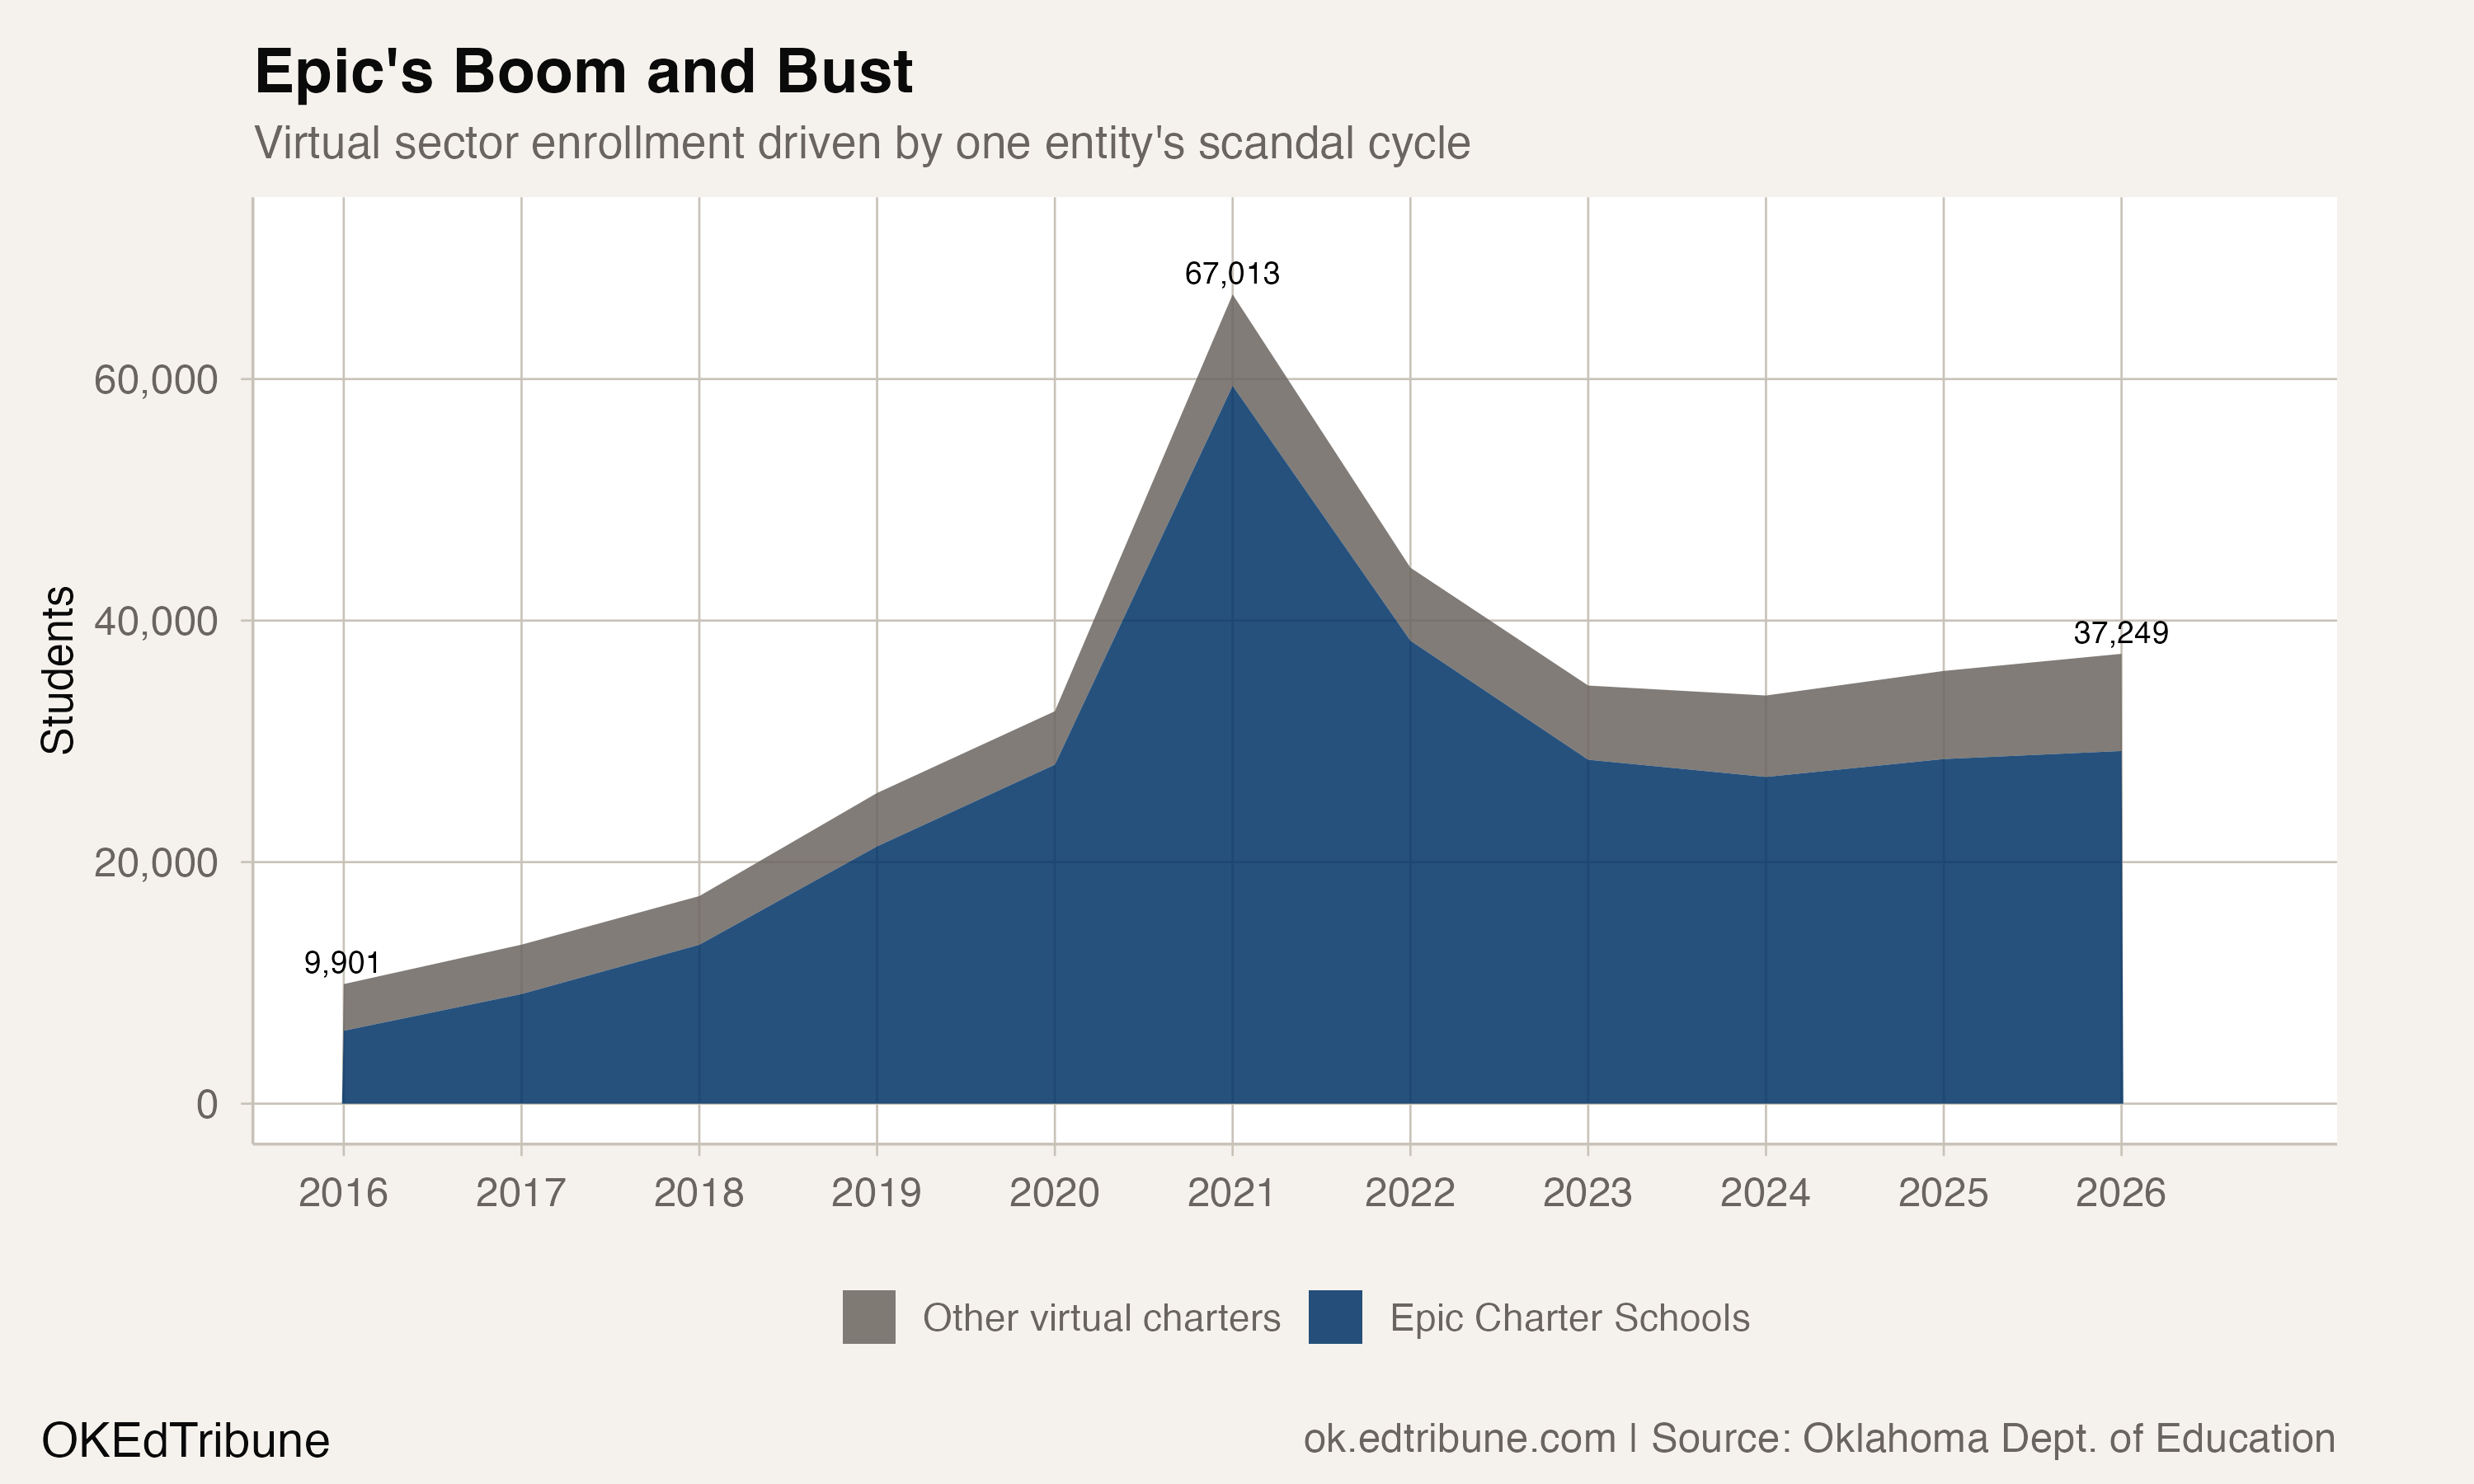
The pandemic changed the scale. In the single year from 2019-20 to 2020-21, traditional schools lost 44,056 students. Virtual charter enrollment doubled from 32,494 to 67,013. The state total fell by only 9,537, because the vast majority of the traditional loss transferred to virtual seats, not out of the public system entirely.
What happened next was partial, then reversed. Traditional enrollment rebounded by 39,537 students between 2020-21 and 2022-23, recovering roughly 90% of its COVID-year loss. But that recovery stalled. Since 2022-23, traditional schools have lost another 17,168 students. The 2025-26 single-year drop of 12,058 is the largest non-pandemic loss in the dataset, and it brought traditional enrollment to its lowest non-pandemic level in the 11-year series.
Epic's shadow over the data
The virtual sector's story is inseparable from one entity. Epic Charter Schools↗ET enrolled 6,037 students in 2015-16. By 2020-21, that number was 59,445, a tenfold increase that made Epic the largest public school enrollment entity in the state. Its two predecessor entities, Epic One on One and Epic Blended Learning, merged into a single district reporting unit in 2022-23 at 28,478 students, roughly half the peak.
Epic's co-founders, Ben Harris and David Chaney, face felony charges of racketeering, embezzlement, and obtaining money by false pretenses. The Oklahoma State Bureau of Investigation inquiry and State Auditor audit allege the co-founders funneled public funds through a Student Learning Fund they controlled. Preliminary hearings concluded in late February 2026 after roughly 18 hours of testimony; a judge will decide in April whether the case proceeds to trial.
"We remain fully focused on presenting the facts and evidence in this case. We are committed to ensuring that no one sidetracks justice or evades accountability." — Attorney General Gentner Drummond, Nov. 2025
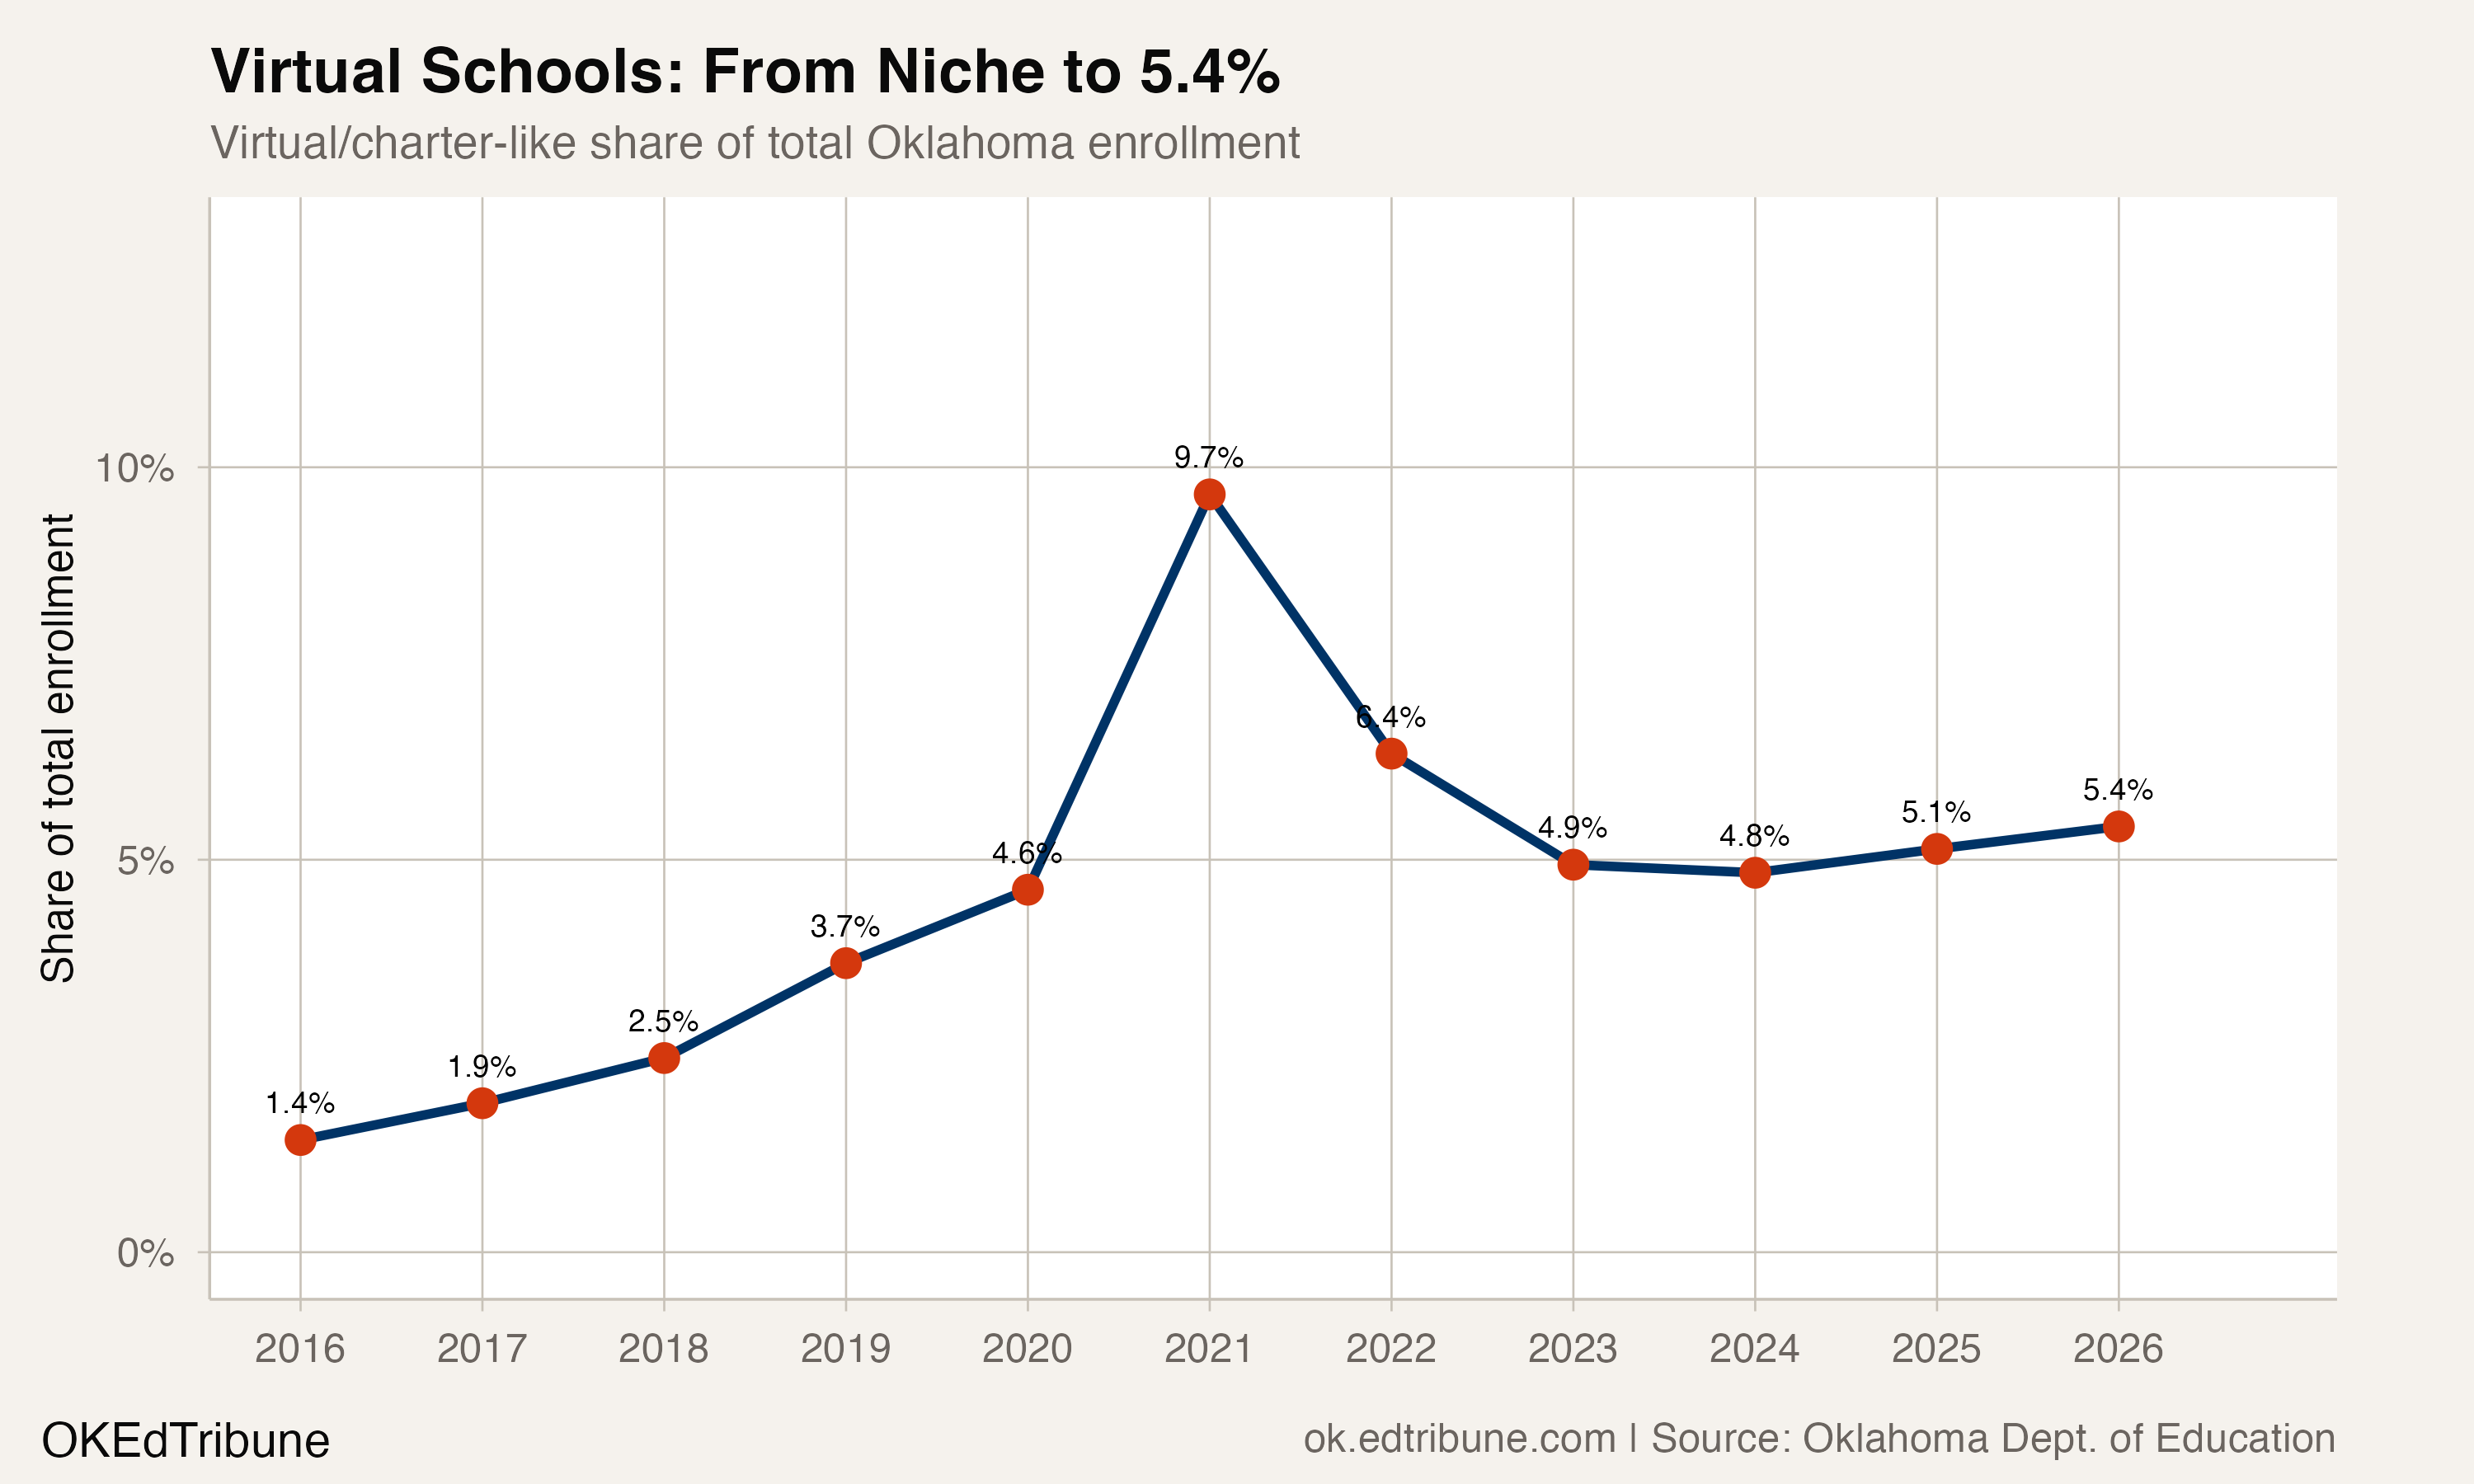
Epic's enrollment has stabilized at 29,201 in 2025-26, still nearly five times its 2015-16 size. The broader virtual sector, including Oklahoma Virtual Charter Academy↗ET (3,966 students), Oklahoma Connections Academy↗ET (1,508), Insight School of Oklahoma↗ET (1,455), and four smaller entities, totals 37,249 students, or 5.4% of statewide enrollment.
In 2015-16, virtual schools held 1.4% of state enrollment. That share spiked to 9.7% during the pandemic year, settled back, and has crept upward to 5.4%. The sector's growth has slowed, but it has not reversed: virtual enrollment in 2025-26 is the highest since the post-pandemic correction.
Two cities, two-thirds of the loss
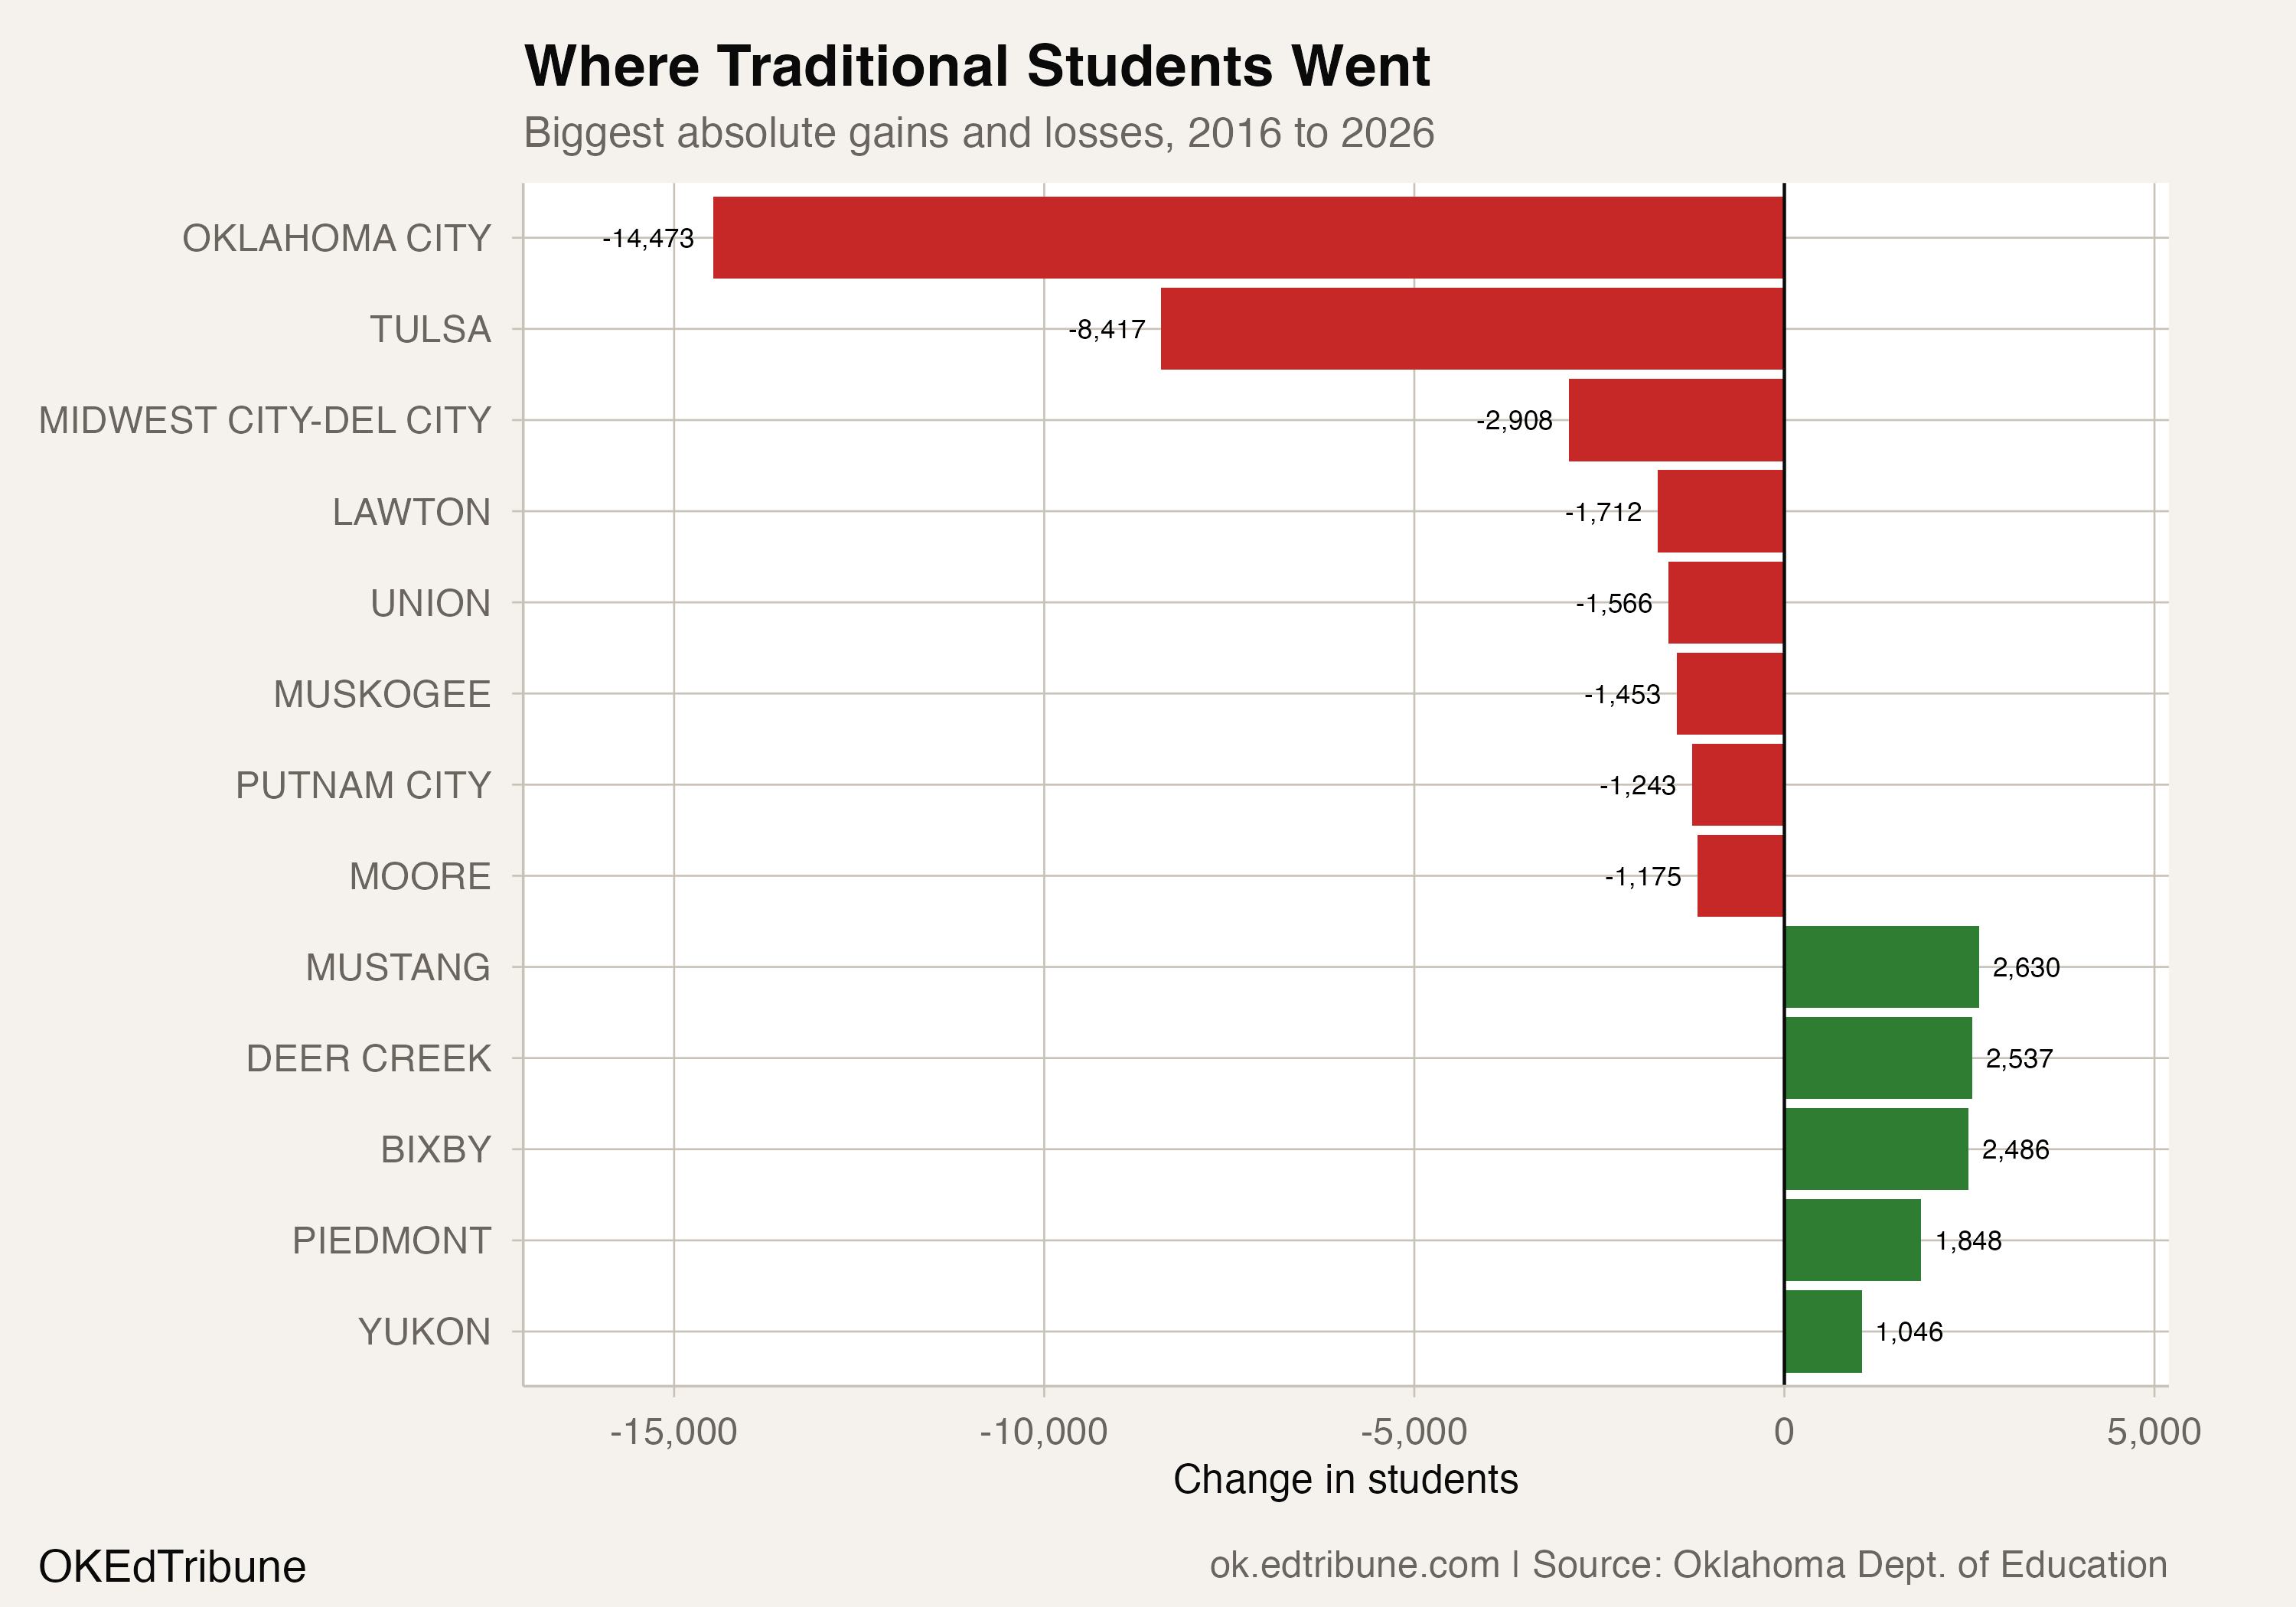
Oklahoma City↗ET and Tulsa↗ET account for 22,890 of the 33,300 traditional students lost since 2015-16, or 68.7% of the total. Oklahoma City alone lost 14,473 students, a 31.8% decline that cost it the title of largest district in the state. Tulsa surpassed Oklahoma City in 2021-22 enrollment counts, the first time since 2013 it held that position. But Tulsa's lead is less a sign of strength than of slower decline: Tulsa itself lost 8,417 students, or 20.6%, over the same period.
Behind them, Midwest City-Del City↗ET (-2,908), Lawton↗ET (-1,712), and Union↗ET (-1,566) round out the top five. Together, these five districts lost 29,076 students, 87.3% of the traditional total.
Of 506 traditional districts with data in both years, 372 lost enrollment. The 132 that grew added a combined 22,987 students, nowhere near enough to offset the 72,523 lost by declining districts. The math is lopsided: for every student gained somewhere, three were lost somewhere else.
The suburban ring gained. It was not enough.
The districts growing fastest sit in the suburban rings around Oklahoma City: Mustang↗ET (+2,630, up 24.4%), Deer Creek↗ET (+2,537, up 45.1%), Bixby↗ET (+2,486, up 41.1%), and Piedmont↗ET (+1,848, up 50.6%). Edmond↗ET and Yukon↗ET added roughly 1,000 each.
The pattern is familiar in every state with a large urban core. Families moving to newer housing stock on the metro fringe take per-pupil funding with them. The suburban gains are real, but they represent redistribution, not growth. The entire ring of gainers absorbed about 11,500 students. Oklahoma City alone lost more than that.
What is driving the acceleration
The most recent year is what distinguishes this story from a slow-burn trend. Traditional schools lost 12,058 students between 2024-25 and 2025-26, more than triple the prior year's loss of 3,779 and the worst non-pandemic year in the series.
Declining birth rates are the most likely structural driver. Oklahoma Watch reported in January 2026 that falling birth rates are the primary factor behind the enrollment drop, with steeper losses concentrated in pre-K through third grade, the grades where smaller birth cohorts first appear in enrollment data.
A second contributing factor is the state's expanding school choice landscape. Oklahoma's Parental Choice Tax Credit, which provides $5,000 to $7,500 per child for private school tuition, approved 37,428 children for the 2025-26 school year, with 3,278 identified as switching from public to private schools for the first time. The program has nearly exhausted its $250 million cap. Whether the tax credit is drawing students who would have left anyway or accelerating departures is not yet clear from enrollment data alone. The 3,278 confirmed switchers represent a fraction of the 12,058 traditional-sector loss, but the program is in its second year and the cap may increase.
A third factor is the expiration of federal pandemic relief funds. Districts that used ESSER dollars to retain staff or add programs now face the same enrollment-driven budget pressure without the cushion.
"Operating a school building has fixed costs whether filled with 200 or 400 students, but fewer students means fewer dollars." — Oklahoma Watch, January 2026
The data cannot distinguish how much of the 2025-26 cliff is birth-rate driven, how much reflects private school transfers, and how much is families leaving the state. Oklahoma does not publish a public-to-private transfer dataset, and the Parental Choice Tax Credit reports identify only a subset of families who applied for the credit, not all private school enrollment.
What comes next
Virtual charters are growing modestly. Traditional schools are accelerating downward. The state total blends them together and produces a number that looks almost stable. That blending has been hiding a 33,300-student loss for a decade.
The mismatch matters most at budget time. A superintendent in a traditional district does not compete against the state average. She competes against the per-pupil formula, which sends dollars wherever students sit, and against the fixed cost of a building that was designed for 600 students and now holds 450. The headline enrollment number told her the state was roughly stable. Her empty classrooms told her something different. The classrooms were right.
Detailed code that reproduces the analysis and figures in this article is available exclusively to EdTribune subscribers.
Discussion
Sign in to join the discussion.
Loading comments...